
Unaudited results for the six months to 30/06/2026

Arbuthnot Banking Group PLC
21 July 2026
21 July 2026
For immediate release
ARBUTHNOT BANKING GROUP PLC ("Arbuthnot", "the Company", "the Group" or "ABG")
Unaudited results for the six months to 30 June 2026
Arbuthnot Banking Group PLC is the holding company for Arbuthnot Latham & Co., Limited.
FINANCIAL HIGHLIGHTS
|
• |
Profit before tax of £11.0m for the six months to 30 June 2026 (30 June 2025: £10.9m) |
|
• |
Earnings per share of 49.9p (30 June 2025: 42.5p) |
|
• |
Interim dividend of 24p per share, a 2p increase on the 2025 interim dividend (30 June 2025: 22p per share) |
|
• |
Further growth in net assets per share to 1712p (30 June 2025: 1649p, 31 December 2025: 1694p) |
|
• |
CET1 capital ratio of 12.0% (30 June 2025: 12.7%, 31 December 2025: 13.3%) and a total capital ratio of 13.9% (30 June 2025: 14.8%, 31 December 2025: 15.4%) |
OPERATIONAL HIGHLIGHTS
|
• |
Future State 2 target of £10bn client balances achieved over two years ahead of target |
|
• |
Specialist Division lending balances exceeded £1bn after strong operational momentum, to finish the period at £1,049.4m (30 June 2025: £895.9m; 31 December 2025: £888.2m), a 18% increase since the end of 2025 and a 17% increase year on year |
|
• |
Continued growth in customer deposits to £4.78bn (30 June 2025: £4.42bn; 31 December 2025: £4.57bn), a 4% increase in the first half of the year and a 8% increase year on year |
|
• |
Customer loans (including leased assets) of £2.45bn (30 June 2025: £2.32bn; 31 December 2025: £2.25bn), an increase of 9% in the first half of the year, and a 6% increase year on year, as lending discipline was maintained |
|
• |
Funds under Management and Administration (FUMA) of £3.00bn (30 June 2025: £2.38bn; 31 December 2025: £2.68bn), a 12% increase against 31 December 2025 and an increase of 26% year on year, with net inflows of £189m in the first half |
Commenting on the results, Sir Henry Angest, Chairman and Chief Executive of Arbuthnot, said: "Arbuthnot has delivered good growth across all of our business lines, with especially encouraging growth in our relationship deposit base, funds under management and specialist commercial lending. The continued strength of the business is reflected in the decision to increase the interim dividend by 9 per cent even though, as anticipated, these results reflect the effect of a series of reductions in the base rate over the last twelve months. Despite the uncertain economic backdrop, the Group remains well positioned to continue to grow by taking market share while maintaining our disciplined approach to credit, liquidity and capital management."
The Directors of the Company accept responsibility for the contents of this announcement.
The information contained within this announcement is deemed to constitute inside information as stipulated under the retained EU law version of the Market Abuse Regulation (EU) No. 596/2014 (the "UK MAR") which is part of UK law by virtue of the European Union (Withdrawal) Act 2018. The information is disclosed in accordance with the Company's obligations under Article 17 of the UK MAR. Upon the publication of this announcement, this inside information is now considered to be in the public domain.
|
ENQUIRIES: |
|
|
Arbuthnot Banking Group |
020 7012 2400 |
|
Sir Henry Angest, Chairman and Chief Executive |
|
|
Andrew Salmon, Group Chief Operating Officer |
|
|
James Cobb, Group Finance Director |
|
|
Grant Thornton UK LLP (Nominated Adviser and AQSE Corporate Adviser) |
020 7383 5100 |
|
Colin Aaronson |
|
|
Samantha Harrison |
|
|
Ciara Donnelly |
|
|
Shore Capital (Broker) |
020 7408 4090 |
|
Daniel Bush |
|
|
David Coaten |
|
|
Tom Knibbs |
|
|
H/Advisors Maitland (Financial PR) |
020 7379 5151 |
|
Neil Bennett |
|
|
Sam Cartwright |
Chairman's Statement
The Group has reported a profit before tax of £11.0m for the first six months of the year compared to £10.9m in the same period last year.
As previously noted, the Group's financial performance can be affected by the level of the Bank of England base rate, as earnings on our significant liquidity resources are linked to the base rate. Over the first six months of 2026, the average Bank of England base rate was 3.75%, compared with 4.48% in the same period in 2025, a reduction of 73bps. However, given the issues in the Middle East, which could lead to higher inflation as the oil price shock becomes embedded in the supply chain, the likelihood of further near-term interest rate cuts seems to have receded.
The small increase in profits compared to the prior year does not fully capture the underlying operational progress delivered across the Group. Given the economic backdrop, I am pleased to note that we have delivered good growth across all of our business lines. Notably, our Wealth Management division reached £3.0bn in funds under management and administration during June.
Our specialist lending divisions have now in aggregate exceeded £1bn in customer loan balances (including operating leases) as we continue to diversify our lending portfolios according to our strategic plans.
Also, we have achieved our "Future State 2" target of £10bn in total client balances (loans, assets available for lease, deposits and funds under management and administration) more than two years ahead of our five-year target. This is a good indicator of how we continue to build a balanced business rather than rely on one side of the balance sheet for growth.
Within our businesses I would like to take this opportunity to highlight the following notable areas of performance. Firstly, our asset finance business, Renaissance Asset Finance (RAF), has achieved loan book growth of £82.2m which is 29% growth in the first six months of the year and 32% since the same point last year. Secondly, Arbuthnot Commercial Asset Based Lending (ACABL) returned to growth in the first half as the level of corporate transactions and private equity activity picked up. The customer loan balances grew by £62.8m or 29% since the year end. Finally, the Wealth Management division reached £3.0bn in funds under management and administration, representing portfolio growth of £319.2m or 12% since the 2025 year end.
Given the continued progress being made by the Group, the Board has decided to pay an interim dividend of 24p per ordinary and ordinary non-voting share, an increase of 2p compared to the interim dividend paid in the prior year. The dividend will be paid on 25 September 2026 to shareholders on the register on 28 August 2026.
On 1 June 2026 we welcomed Stephen Fletcher to the Board as a non-independent, non-executive director. This was after he retired from his executive duties at the end of December 2025. He has a deep understanding and wealth of experience gained from his time with our bank and also prior to that with senior roles at RBS and Coutts.
Banking
Banking's relationship-led approach continued to support the growth and retention of criteria clients across its Private and Commercial Banking propositions. In the first six months of 2026 the Bank completed its client survey, with our Net Promoter Score increasing 2.1 to 70.2 compared to 2025 and the people satisfaction score increasing 1.0 to 96.1, both of which are considered industry leading metrics.
Deposits finished the period at £4.78bn, a 4% increase against the year end. However, this is after approximately £250m of seasonal outflows of private banking client payments to HMRC, which was offset by commercial banking deposit growth. In addition, much of the success of the H1 2026 inflows into our wealth management business have also come from clients' cash with Arbuthnot Latham. Given that much of the inflows to our wealth management business have come from existing clients' deposits, the overall increase suggests that the Bank has a strong deposit gathering franchise.
The Banking loan book grew £40.9m in the first six months of 2026 and on plan, despite the market seeing less activity and increased competition. The Bank continues to hold to its principles of maintaining high quality credit lending to borrowers with strong asset bases, resulting in watchlist client numbers now being at medium term historic low levels.
Wealth Management
Funds Under Management & Administration (FUMA) continued to grow in the first half of 2026 to finish June at £3.00bn, up 12% from the start of the year and representing growth of 26% year on year (30 June 2025: £2.38bn). This was despite the conflict in the Middle East creating volatility in the equity markets as investors weighed up the potential impact on different regions and sectors. Gross inflows of £343m, equivalent to 25% growth on an annualised basis, demonstrate the continued strong organic growth of the Wealth Management business.
In April, the business achieved a key milestone by launching its first fund range. Leveraging the existing macro-led framework and broadly reflecting the Investment Committee's tactical allocation in our flagship Global Investment Service, the funds provide a more accessible investment vehicle for those clients with lower levels of capital. In July, the business will also launch its Global Direct Service which will provide direct access to bonds and equities. The service will support investors seeking a portfolio of global quality growth companies whilst also opening our Wealth Management proposition to US connected clients.
Arbuthnot Commercial Asset Based Lending (ACABL)
ACABL reported a profit before tax of £4.3m compared to £4.8m for the same period the prior year. The business had pleasing growth in lending balances in the first half of 2026, increasing its loan book from £219.4m at the previous year end to £282.1m at the end of June, representing growth of 29% for the six months and 22% year on year.
The loan book growth was achieved from a combination of new clients, two thirds of which related to event driven transactions, as well as additional facilities to existing relationships, both of which more than offset attrition. The current pipeline indicates that the momentum in loan book growth is expected to continue for 2026.
Following previous economic uncertainty, many portfolio clients have proactively built up cash reserves, which has proven beneficial in shielding them from current rising energy prices and broader market pressures. As a consequence, new watchlist cases for ACABL have reduced.
Renaissance Asset Finance (RAF)
RAF reported a profit before tax of £3.8m (30 June 2025: £3.3m), an increase of 17% compared to the same period in the prior year. It finished the first half with a loan book of £369.4m, equating to annual growth of 32% when compared to the loan book of £279.7m at the same period in the prior year; growth in loan balances was £82.2m since December 2025.
The majority of growth came from RAF's core specialism of financing high value cars for high-net-worth individuals. The business also achieved a key milestone in the first half of 2026, exceeding £1bn lent since its inception in 2014.
The Block Discounting business, launched in late 2021, continues to generate significant growth, reporting a 21% increase over the period.
Asset Alliance Group (AAG)
AAG reported a profit before tax of £0.8m (30 June 2025: £0.5m loss), with Assets Available to Lease of £397.9m compared to £382.8m at the previous year end. Origination for the first six months of 2026 was £15.1m. Whilst the coach market has been impacted by increased fuel costs, the bus sector remains more resilient.
The lending portfolio is now well balanced between commercial vehicles and buses, providing greater resilience against external macro-economic forces. Trading in used, end of lease commercial vehicles has also shown signs of recovery in the period, with sales now running at a profit rather than the losses experienced in 2025.
Operations
The Bank has continued to invest in people and technology that support its growth strategy, with a focus on leveraging and optimising investments and maximising the utilisation of technology.
Transformation projects and initiatives continue to focus on improving efficiency and enabling functionality that benefits client service, supports operational efficiency and improves operational effectiveness and resilience. AI capabilities have been selectively introduced, testing use case opportunities and business case realism before scaling and deployment.
Outlook
The UK economy has continued to underperform in the wake of global economic and political tensions resulting in stubborn inflation coupled with the possibility of interest rates remaining higher for longer. The war in the Middle East has affected supply chains including global energy markets, and the medium-term negative effect on businesses and households have yet to emerge. However, our client centric service proposition continues to prove popular and allows us to grow by taking market share while maintaining our strongly held corporate principles.
Consolidated Statement of Comprehensive Income
|
Six months ended 30 June |
Six months ended 30 June |
|||
|
2026 |
2025 |
|||
|
Note |
£000 |
£000 |
||
|
Income from banking activities |
||||
|
Interest income |
114,750 |
125,213 |
||
|
Interest expense |
(55,179) |
(66,493) |
||
|
Net interest income |
|
|
59,571 |
58,720 |
|
Fee and commission income |
17,325 |
15,161 |
||
|
Fee and commission expense |
(558) |
(582) |
||
|
Net fee and commission income |
16,767 |
14,579 |
||
|
Operating income from banking activities |
76,338 |
73,299 |
||
|
Income from leasing activities |
||||
|
Revenue |
56,990 |
57,146 |
||
|
Cost of goods sold |
(45,106) |
(45,556) |
||
|
Gross profit from leasing activities |
11,884 |
11,590 |
||
|
Total group operating income |
88,222 |
84,889 |
||
|
Net impairment loss on financial assets |
(1,834) |
(1,440) |
||
|
Other income |
6 |
851 |
724 |
|
|
Operating expenses |
(76,201) |
(73,319) |
||
|
Profit before income tax |
|
|
11,038 |
10,854 |
|
Income tax expense |
(2,902) |
(3,916) |
||
|
Profit for the period |
|
|
8,136 |
6,938 |
|
|
|
|
||
|
Other comprehensive income |
|
|
||
|
Items that will not be reclassified to profit or loss |
|
|
||
|
Changes in fair value of equity investments at fair value through other comprehensive income |
|
|
(2) |
22 |
|
Tax on other comprehensive income |
|
|
1 |
(6) |
|
Other comprehensive income for the period, net of tax |
(1) |
16 |
||
|
Total comprehensive income for the period |
|
|
8,135 |
6,954 |
|
|
|
|
||
|
Earnings per share for profit attributable to the equity holders of the Company during the period (expressed in pence per share): |
|
|
||
|
Basic earnings per share |
7 |
49.9 |
42.5 |
|
|
Diluted earnings per share |
7 |
49.9 |
42.5 |
Consolidated Statement of Financial Position
|
At 30 June |
At 30 June |
At 31 December |
|||
|
2026 |
2025 |
2025 |
|||
|
£000 |
£000 |
£000 |
|||
|
ASSETS |
|||||
|
Cash and balances at central banks |
522,670 |
768,724 |
437,548 |
||
|
Loans and advances to banks |
61,097 |
83,573 |
117,497 |
||
|
Debt securities at amortised cost |
2,037,429 |
1,690,403 |
2,033,158 |
||
|
Derivative financial instruments |
902 |
2,030 |
1,398 |
||
|
Loans and advances to customers |
2,155,808 |
2,019,258 |
1,960,542 |
||
|
Current tax asset |
1,041 |
- |
1,619 |
||
|
Other assets |
48,868 |
51,690 |
50,247 |
||
|
Financial investments |
2,071 |
4,975 |
2,061 |
||
|
Intangible assets |
34,447 |
30,887 |
33,448 |
||
|
Property, plant and equipment |
314,759 |
324,135 |
310,569 |
||
|
Right-of-use assets |
43,759 |
45,688 |
44,501 |
||
|
Investment properties |
5,250 |
5,250 |
5,250 |
||
|
Total assets |
5,228,101 |
5,026,613 |
4,997,838 |
||
|
EQUITY AND LIABILITIES |
|||||
|
Equity attributable to owners of the parent |
|||||
|
Share capital |
167 |
167 |
167 |
||
|
Share premium account |
11,606 |
11,606 |
11,606 |
||
|
Retained earnings |
268,815 |
256,779 |
265,738 |
||
|
Other reserves |
(1,114) |
624 |
(1,113) |
||
|
Total equity |
279,474 |
269,176 |
276,398 |
||
|
LIABILITIES |
|||||
|
Deposits from banks |
21,094 |
196,965 |
1,389 |
||
|
Deposits from customers |
4,775,439 |
4,418,019 |
4,570,365 |
||
|
Current tax liability |
- |
1,641 |
- |
||
|
Other liabilities |
46,052 |
40,755 |
42,489 |
||
|
Deferred tax liability |
9,721 |
5,501 |
10,258 |
||
|
Lease liabilities |
57,795 |
56,164 |
58,267 |
||
|
Debt securities in issue |
38,526 |
38,392 |
38,672 |
||
|
Total liabilities |
4,948,627 |
4,757,437 |
4,721,440 |
||
|
Total equity and liabilities |
5,228,101 |
5,026,613 |
4,997,838 |
Consolidated Statement of Changes in Equity
|
Attributable to equity holders of the Group |
|||||||
|
|
Share capital |
Share premium |
Capital redemption reserve |
Fair value reserve |
Treasury shares |
Retained earnings |
Total |
|
£000 |
£000 |
£000 |
£000 |
£000 |
£000 |
£000 |
|
|
Balance at 1 January 2026 |
167 |
11,606 |
19 |
167 |
(1,299) |
265,738 |
276,398 |
|
|
|||||||
|
Total comprehensive income for the period |
|||||||
|
Profit for the six months ended 30 June 2026 |
- |
- |
- |
- |
- |
8,136 |
8,136 |
|
Other comprehensive income, net of tax |
|||||||
|
Changes in the fair value of financial assets at FVOCI |
- |
- |
- |
(2) |
- |
- |
(2) |
|
Tax on other comprehensive income |
- |
- |
- |
1 |
- |
- |
1 |
|
Total other comprehensive income |
- |
- |
- |
(1) |
- |
- |
(1) |
|
Total comprehensive income for the period |
- |
- |
- |
(1) |
- |
8,136 |
8,135 |
|
Transactions with owners, recorded directly in equity |
|||||||
|
Contributions by and distributions to owners |
|||||||
|
Final dividend relating to 2025 |
- |
- |
- |
- |
- |
(5,059) |
(5,059) |
|
Total contributions by and distributions to owners |
- |
- |
- |
- |
- |
(5,059) |
(5,059) |
|
Balance at 30 June 2026 |
167 |
11,606 |
19 |
166 |
(1,299) |
268,815 |
279,474 |
|
Attributable to equity holders of the Group |
|||||||
|
|
Share capital |
Share premium |
Capital redemption reserve |
Fair value reserve |
Treasury shares |
Retained earnings |
Total |
|
£000 |
£000 |
£000 |
£000 |
£000 |
£000 |
£000 |
|
|
Balance at 1 January 2025 |
167 |
11,606 |
19 |
1,888 |
(1,299) |
254,575 |
266,956 |
|
|
|||||||
|
Total comprehensive income for the period |
|||||||
|
Profit for the six months ended 30 June 2025 |
- |
- |
- |
- |
- |
6,938 |
6,938 |
|
Other comprehensive income, net of income tax |
|||||||
|
Changes in the fair value of financial assets at FVOCI |
- |
- |
- |
22 |
- |
- |
22 |
|
Tax on other comprehensive income |
- |
- |
- |
(6) |
- |
- |
(6) |
|
Total other comprehensive income |
- |
- |
- |
16 |
- |
- |
16 |
|
Total comprehensive income for the period |
- |
- |
- |
16 |
- |
6,938 |
6,954 |
|
Transactions with owners, recorded directly in equity |
|||||||
|
Contributions by and distributions to owners |
|||||||
|
Final dividend relating to 2024 |
- |
- |
- |
- |
- |
(4,734) |
(4,734) |
|
Total contributions by and distributions to owners |
- |
- |
- |
- |
- |
(4,734) |
(4,734) |
|
Balance at 30 June 2025 |
167 |
11,606 |
19 |
1,904 |
(1,299) |
256,779 |
269,176 |
Consolidated Statement of Cash Flows
|
Six months ended 30 June |
Six months ended 30 June |
|||
|
2026 |
2025 |
|||
|
£000 |
£000 |
|||
|
Cash flows from operating activities |
||||
|
Profit before tax |
11,038 |
10,854 |
||
|
Adjustments for: |
||||
|
- Depreciation and amortisation |
5,021 |
5,384 |
||
|
- Impairment loss on loans and advances |
696 |
770 |
||
|
- Net interest income |
25 |
(32) |
||
|
- Elimination of exchange differences on debt securities |
(5,206) |
(388) |
||
|
- Other non-cash or non-operating items included in profit before tax |
(6) |
(105) |
||
|
- Tax paid |
(2,859) |
(5,452) |
||
|
Cash flows from operating profits before changes in operating assets and liabilities |
8,709 |
11,031 |
||
|
Changes in operating assets and liabilities: |
||||
|
- net decrease in derivative financial instruments |
496 |
940 |
||
|
- net (increase)/decrease in loans and advances to customers |
(195,962) |
74,184 |
||
|
- net increase in assets held for leasing |
(5,334) |
(11,377) |
||
|
- net decrease in other operating assets |
1,379 |
11 |
||
|
- net increase in amounts due to customers |
205,074 |
285,526 |
||
|
- net increase in other operating liabilities |
3,562 |
6,908 |
||
|
Net cash inflow from operating activities |
17,924 |
367,223 |
||
|
Cash flows from investing activities |
||||
|
Acquisition of financial investments |
(12) |
(7) |
||
|
Purchase of computer software |
(2,587) |
(1,642) |
||
|
Purchase of property, plant and equipment |
(480) |
(1,528) |
||
|
Purchases of debt securities |
(1,768,013) |
(1,411,513) |
||
|
Proceeds from redemption of debt securities |
1,768,783 |
920,957 |
||
|
Net cash outflow from investing activities |
(2,309) |
(493,733) |
||
|
Cash flows from financing activities |
||||
|
Increase in borrowings |
19,705 |
4,884 |
||
|
Repayment of principal portions of lease liabilities |
(1,539) |
(201) |
||
|
Dividends paid |
(5,059) |
(4,734) |
||
|
Net cash used in financing activities |
13,107 |
(51) |
||
|
Net increase/(decrease) in cash and cash equivalents |
28,722 |
(126,561) |
||
|
Cash and cash equivalents at 1 January |
555,045 |
978,858 |
||
|
Cash and cash equivalents at 30 June |
583,767 |
852,297 |
||
|
|
|
|
||
Notes to the Consolidated Financial Statements
1. Basis of preparation
The interim financial statements have been prepared on the basis of accounting policies set out in the Group's 2025 statutory accounts as amended by UK-adopted standards and interpretations effective during 2026 as set out below and in accordance with IAS 34 "Interim Financial Reporting" as adopted for use in the UK. The directors do not consider the fair value of the assets and liabilities presented in these financial statements to be materially different from their carrying value.
The statements were approved by the Board of Directors on 20 July 2026 and are unaudited. The interim financial statements will be available on the Group website (www.arbuthnotgroup.com).
2. Risks and Uncertainties
The Group regards the monitoring and controlling of risks and uncertainties as a fundamental part of the management process. Consequently, senior management are involved in the development of risk management policies and in monitoring their application. A detailed description of the risk management framework and associated policies is set out in Note 4.
The principal risks inherent in the Group's business are reputational, macroeconomic and competitive environment, strategic, credit, market, liquidity, operational, cyber, residual value, conduct and, regulatory and capital.
Reputational risk
Reputational risk is the risk to the Group from a failure to meet reasonable stakeholder expectations as a result of any event, behaviour, action or inaction by ABG itself, its employees or those with whom it is associated. This includes the associated risk to earnings, capital or liquidity.
ABG seeks to ensure that all of its businesses act consistently with the seven corporate principles as laid out on page 3 of the Annual Report and Accounts. This is achieved through a central Risk Management framework and supporting policies, the application of a three-lines of defence model across the Group and oversight by various committees. Employees are supported in training, studies and other ways and encouraged to live out the cultural values within the Group of integrity, energy and drive, respect, collaboration and empowerment. In applying the seven corporate principles, the risk of reputational damage is minimised as the Group serves its shareholders, customers and employees with integrity and high ethical standards.
Macroeconomic and competitive environment
The Group is exposed to risks that may arise from the macroeconomic and competitive environment.
In recent years there have been a number of global and domestic events which have had significant implications for the Group's operating environment, namely: conflict in the Middle East, Russia's war in the Ukraine, and Coronavirus. The culmination of these events has led to significant turmoil in both global and domestic markets. Geo-political volatility and uncertainty remains high with the potential to adversely affect the UK economy, as well as the Group's customers and assets.
Strategic risk
Strategic risk is the risk that the Group's ability to achieve its corporate and strategic objectives may be compromised. This risk is particularly important to the Group as it continues its growth strategy. However, the Group seeks to mitigate strategic risk by focusing on a sustainable business model which is aligned to the Group's business strategy. Also, the Directors normally meet once a year to ensure that the Group's strategy is appropriate for the market and economy.
Credit risk
Credit risk is the risk that a counterparty (borrower) will be unable to pay amounts in full when due. This risk exists in Arbuthnot Latham, which currently has a loan book of £2.2bn (30 June 2025: £2.0bn). The lending portfolio in Arbuthnot Latham is extended to clients, the majority of which is secured against cash, property or other high quality assets. Credit risk is managed through the Credit Committee of Arbuthnot Latham.
Market risk
Market risk arises in relation to movements in interest rates, currencies, property and equity markets.
Interest rate and currency risk
The Group's treasury function operates mainly to provide a service to clients and does not take significant unmatched positions in any market for its own account. As a result, the Group's exposure to adverse movements in interest rates and currencies is limited to interest earnings on its free cash and interest rate re-pricing mismatches. The Group actively monitors its exposure to future changes in interest rates. However, at the current time the Group does not hedge the earnings from the free cash which currently totals £523m (31 December 2025: £437m). The cost of hedging is prohibitive. We continue to hold cash at the Bank of England whilst investing some of the excess liquidity into high quality short dated fixed income assets, such as UK Gilts and Treasury Bills. As a result, treasury assets remain at a similar level to year end at £2.1bn (31 December 2025: £2.15bn). By investing in these short-dated securities, we partially mitigate the impact of changes in interest rates by 3 to 12 months.
Property and equity market risk
The Group is exposed to changes in the market value of its properties. The current carrying value of Investment Property is £5.3m (31 December 2025: £5.3m) and properties classified as inventory are carried at £15.2m (31 December 2025: £16.0m). Any changes in the market value of the property will be accounted for in the Income Statement for the Investment Property and could also impact the carrying value of inventory, which is at the lower of cost and net realisable value. As a result, it could have a significant impact on the profit or loss of the Group. The Group is also exposed to changes in the value of equity investments. The current carrying value of financial investments is £2.1m (31 December 2025: £2.1m). Any changes in the value of financial investments will be accounted for in Other Comprehensive Income.
Liquidity risk
Liquidity risk is the risk that the Group, although solvent, either does not have sufficient financial resources to enable it to meet its obligations as they fall due, or can only secure such resources at an excessive cost. The Group takes a conservative approach to managing its liquidity profile. The Bank is funded by retail deposits and capital. Additionally, Arbuthnot Latham maintains access to the Bank of England's Sterling Monetary Framework, including reserves account. The loan to deposit ratio is maintained at a prudent level, and consequently the Group maintains a high level of liquidity. The Arbuthnot Latham Board Risk Committee annually approves the Internal Liquidity Adequacy Assessment Process ("ILAAP"). The Directors model various stress scenarios and assess the resultant cash flows in order to evaluate the Group's potential liquidity requirements. The Directors firmly believe that sufficient liquid assets are held to enable the Group to meet its liabilities in a stressed environment.
Operational risk
Operational risk is the risk that the Group may be exposed to financial losses from conducting its business. The Group's exposure to operational risk include its Information Technology ("IT") and Operating platforms. There are additional internal controls in these processes that are designed to protect the Group from these risks. The Group's overall approach to managing internal control and financial reporting is described in the Corporate Governance section of the Annual Report.
In line with guidance issued by the Regulator, the Bank has continued to focus on ensuring that the design of systems and operational plans are robust to maintain operational resilience in the face of unexpected incidents.
Cyber risk
Cyber risk is an increasing risk for the Group within its operational processes. It is the risk that the Group is subject to some form of disruption arising from an interruption to its IT and data infrastructure. The Group regularly tests the infrastructure to ensure that it remains robust to a range of threats and has continuity of business plans in place including a disaster recovery plan.
Residual value risk
Residual value risk equals the difference in the residual value of a leased asset set at lease inception and the lower salvage value realised upon its disposal or re-lease at the end of the lease term. The Group is exposed to residual value risk in its AAG business. Normal residual value risk is managed through the process set out below, and it should be noted that the transition to greener technology may further impact residual values in two ways. Firstly, residual values could decrease due to assets becoming obsolete; climate related regulations might change, which could result in legal restrictions on the use of assets or technological advances could lead to preferred environmental technologies. Secondly, the lack of historical information on green vehicles could lead to inaccurate measurement of residual values at inception of leases.
The AAG business manages Residual Value setting through its Residual Value Committee that comprises representatives from its Asset Management, Procurement, Sales and Leasing divisions and is chaired by the Residual Value Manager. Assets are valued using either an approved Residual Value matrix or individually, dependent upon the nature of the asset and current market conditions. The strategy for Residual Value setting and oversight of the Residual Value Committee is conducted by the AAG Residual Risk Committee, which in turn reports into the Asset Alliance Group Holdings Limited board. The Residual Risk Committee, chaired by the AAG Group Risk Director, includes AAG CEO, AL Group Risk Director, AAG Managing Director, AAG Finance Director and heads of Asset Management, Sales and Leasing divisions in AAG.
Conduct risk
As a financial services provider the Group faces conduct risk, including selling products to customers which do not meet their needs, failing to deal with clients' complaints effectively, not meeting clients' expectations, and exhibiting behaviours which do not meet market or regulatory standards.
The Group adopts a low risk appetite for any unfair customer outcomes. It maintains clear compliance guidelines and provides ongoing training to all employees. Periodic spot checks, compliance monitoring and internal audits are performed to ensure these guidelines are followed. The Group also has insurance policies in place to provide some cover for any claims that may arise.
Financial Crime
The Group is exposed to risk due to financial crime including money laundering, sanctions evasion, bribery and corruption, market abuse, tax evasion and fraud. The Group operates policies and controls which are designed to ensure that financial crime risks are identified, appropriately mitigated and managed.
Regulatory and capital risk
Regulatory and capital risk includes the risk that the Group will have insufficient capital resources to support the business and/or does not comply with regulatory requirements. The Group adopts a conservative approach to managing its capital. The Board of Arbuthnot Latham approves an ICAAP annually, which includes the performance of stringent stress tests to ensure that capital resources are adequate over a three year horizon. Capital and liquidity ratios are regularly monitored against the Board's approved risk appetite as part of the risk management framework.
Regulatory change also exists as a risk to the Group's business. Notwithstanding the assessments carried out by the Group to manage regulatory risk, it is not possible to predict how regulatory and legislative changes may alter and impact the business. Significant and unforeseen regulatory changes may reduce the Group's competitive situation and lower its profitability.
3. Critical accounting estimates and judgements in applying accounting policies
The Group makes estimates and assumptions that affect the reported amounts of assets and liabilities within the next financial year. Estimates and judgements are continually evaluated and are based on historical experience and other factors, including expectations of future events that are believed to be reasonable under the circumstances. For a full list of critical accounting estimates and judgements, please refer back to the Annual Report and Accounts for 2025. Assumptions surrounding credit losses are discussed in more detail below, while other critical accounting estimates and judgements have remained unchanged from what was previously reported.
Estimation uncertainty - Expected credit losses ("ECL") on financial assets
The Group reviews its loan portfolios and debt security investments to assess impairment at least on a quarterly basis. The measurement of ECL required by IFRS 9, necessitates a number of significant judgements. Specifically, judgements and estimation uncertainties relate to assessment of whether credit risk on the financial asset has increased significantly since initial recognition, incorporation of forward-looking information ("FLI") in the measurement of ECLs and key assumptions used in estimating recoverable cash flows. These estimates are driven by a number of factors that are subject to change which may result in different levels of ECL allowances.
The Group incorporates FLI into the assessment of whether there has been a significant increase in credit risk. Forecasts for key macroeconomic variables that most closely correlate with the Bank's portfolio are used to produce five economic scenarios, comprising of a Baseline, which is the central scenario, developed internally based on public consensus forecasts, and four less likely scenarios, one upside and three downside scenarios (Downside 1, Downside 2 and Extreme Downside), and the impacts of these scenarios are then probability weighted. The estimation and application of this FLI will require significant judgement supported by the use of external information.
12-month ECLs on loans and advances (loans within Stage 1) are calculated using a statistical model on a collective basis, grouped together by product and geographical location. The key assumptions are the probability of default, the economic scenarios and loss given default ("LGD") having consideration for collateral. Lifetime ECLs on loans and advances (loans within Stage 2 and 3) are calculated based on an individual valuation of the underlying asset and other expected cash flows.
For financial assets in Stage 2 and 3, ECL is calculated on an individual basis and all relevant factors that have a bearing on the expected future cash flows are taken into account. These factors can be subjective and can include the individual circumstances of the borrower, the realisable value of collateral, the Group's position relative to other claimants, and the likely cost to sell and duration of the time to collect. The level of ECL is the difference between the value of the recoverable amount (which is equal to the expected future cash flows discounted at the loan's original effective interest rate), and its carrying amount.
The Group considered the impact of various assumptions on the calculation of ECL (changes in GDP, unemployment rates, inflation, exchange rates, equity prices, wages and collateral values/property prices) and concluded that collateral values/property prices, UK GDP and the UK unemployment rate are key drivers of credit risk and credit losses for each portfolio of financial instruments.
Using an analysis of historical data, management has estimated relationships between macro-economic variables and credit risk and credit losses. The Group estimates each key driver for credit risk over the active forecast period of between two and five years. This is followed by a period of mean reversion of five years.
The five macroeconomic scenarios modelled on future property prices were as follows:
• Baseline
• Upside
• Downside 1
• Downside 2
• Extreme downside
The table below reflect the expected probability weightings applied for each macroeconomic scenario:
|
Probability weighting |
|||||
|
Jun-26 |
Dec-25 |
||||
|
Economic Scenarios |
|
|
|
||
|
|
|
|
|
||
|
Baseline |
50.0% |
49.0% |
|||
|
Upside |
17.0% |
19.0% |
|||
|
Downside 1 |
15.0% |
15.0% |
|||
|
Downside 2 |
9.0% |
9.0% |
|||
|
Extreme downside |
9.0% |
8.0% |
|||
The tables below show the five-year forecasted average growth for property prices, the UK unemployment rate and UK real GDP growth:
|
|
|
30 June 2026 |
||||
|
Base |
Upside |
Downside 1 |
Downside 2 |
Extreme downside |
||
|
Five-year summary |
|
|
|
|
|
|
|
|
|
|
|
|
|
|
|
UK House price index - average growth |
2.6% |
4.8% |
0.7% |
(1.2%) |
(3.1%) |
|
|
UK Commercial real estate price - average growth |
0.6% |
3.5% |
(0.9%) |
(2.3%) |
(3.7%) |
|
|
UK Unemployment rate - average |
5.0% |
4.6% |
5.7% |
6.4% |
7.2% |
|
|
UK GDP - average growth |
1.4% |
2.0% |
0.9% |
0.4% |
0.0% |
|
|
|
|
31 December 2025 |
||||
|
Base |
Upside |
Downside 1 |
Downside 2 |
Extreme downside |
||
|
Five-year summary |
|
|
|
|
|
|
|
|
|
|
|
|
|
|
|
UK House price index - average growth |
3.2% |
5.4% |
1.1% |
(1.0%) |
(3.1%) |
|
|
UK Commercial real estate price - average growth |
1.3% |
2.7% |
(0.3%) |
(2.0%) |
(3.7%) |
|
|
UK Unemployment rate - average |
4.8% |
4.2% |
5.6% |
6.4% |
7.2% |
|
|
UK GDP - average growth |
1.3% |
2.0% |
0.9% |
0.4% |
0.0% |
|
The tables below list the macroeconomic assumptions at 30 June 2026 used in the base, upside and downside scenarios over the five-year forecast period. The assumptions represent the absolute percentage unemployment rates and year-on-year percentage change for GDP and property prices.
|
UK House price index - four quarter growth |
|||||
|
Year |
Baseline |
Upside |
Downside 1 |
Downside 2 |
Extreme downside |
|
|
|
|
|
|
|
|
2026 |
0.9% |
3.8% |
(1.4%) |
(3.7%) |
(6.0%) |
|
2027 |
2.2% |
6.0% |
(2.8%) |
(7.8%) |
(12.8%) |
|
2028 |
3.1% |
4.1% |
(1.6%) |
(6.3%) |
(11.0%) |
|
2029 |
3.4% |
5.1% |
4.7% |
6.0% |
7.4% |
|
2030 |
3.6% |
5.1% |
4.7% |
5.8% |
6.9% |
|
5 year average |
2.6% |
4.8% |
0.7% |
(1.2%) |
(3.1%) |
|
UK Commercial real estate price - four quarter growth |
|||||
|
Year |
Baseline |
Upside |
Downside 1 |
Downside 2 |
Extreme downside |
|
|
|
|
|
|
|
|
2026 |
(1.5%) |
5.6% |
(7.6%) |
(13.8%) |
(20.0%) |
|
2027 |
(0.9%) |
4.9% |
(6.8%) |
(12.8%) |
(18.8%) |
|
2028 |
2.1% |
3.2% |
3.6% |
5.2% |
6.8% |
|
2029 |
1.4% |
1.7% |
3.2% |
5.0% |
6.9% |
|
2030 |
1.8% |
2.1% |
3.4% |
5.0% |
6.6% |
|
5 year average |
0.6% |
3.5% |
(0.9%) |
(2.3%) |
(3.7%) |
|
UK Unemployment rate - annual average |
|||||
|
Year |
Baseline |
Upside |
Downside 1 |
Downside 2 |
Extreme downside |
|
|
|
|
|
|
|
|
2026 |
5.4% |
5.0% |
5.5% |
5.5% |
5.6% |
|
2027 |
5.2% |
4.3% |
6.0% |
6.7% |
7.5% |
|
2028 |
5.0% |
4.7% |
6.1% |
7.2% |
8.4% |
|
2029 |
4.8% |
4.6% |
5.7% |
6.7% |
7.6% |
|
2030 |
4.6% |
4.3% |
5.3% |
6.1% |
6.8% |
|
5 year average |
5.0% |
4.6% |
5.7% |
6.4% |
7.2% |
|
UK GDP - annual growth |
|||||
|
Year |
Baseline |
Upside |
Downside 1 |
Downside 2 |
Extreme downside |
|
|
|
|
|
|
|
|
2026 |
0.9% |
1.9% |
(0.8%) |
(2.6%) |
(4.3%) |
|
2027 |
1.0% |
2.7% |
0.7% |
0.3% |
0.0% |
|
2028 |
1.6% |
2.0% |
1.5% |
1.5% |
1.4% |
|
2029 |
1.7% |
1.7% |
1.6% |
1.5% |
1.4% |
|
2030 |
1.7% |
1.7% |
1.6% |
1.5% |
1.4% |
|
5 year average |
1.4% |
2.0% |
0.9% |
0.4% |
0.0% |
The graphs below plot the historical data for HPI, Commercial real estate price, unemployment rate and GDP growth rate in the UK as well as the forecasted data under each of the five scenarios.
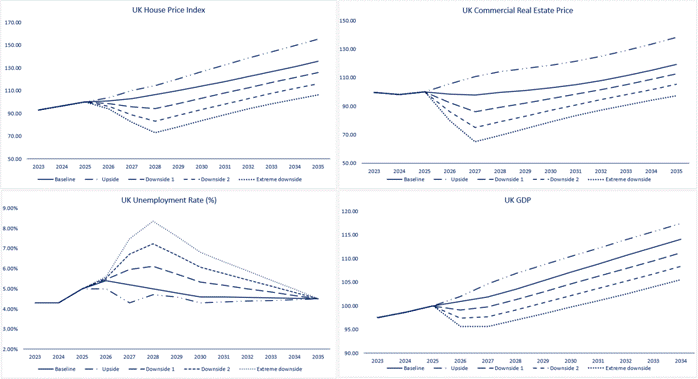
Management have assessed the impact of assigning a 100% probability to each of the economic scenarios, which would have the following impact on the Profit or Loss of the Group:
|
|
|
|||||||
|
|
Jun 2026 |
Dec 2025 |
||||||
|
Impact of 100% scenario probability |
|
£m |
£m |
|||||
|
|
|
|
||||||
|
Baseline |
0.7 |
0.4 |
||||||
|
Upside |
3.2 |
2.6 |
||||||
|
Downside 1 |
(1.1) |
(1.1) |
||||||
|
Downside 2 |
(6.1) |
(5.4) |
||||||
|
Extreme downside |
(22.0) |
(19.6) |
||||||
4. Financial risk management
Strategy
By their nature, the Group's activities are principally related to the use of financial instruments. The Directors and senior management of the Group have formally adopted a Group Risk and Controls Policy which sets out the Board's attitude to risk and internal controls. Key risks identified by the Directors are formally reviewed and assessed at least once a year by the Board, in addition to which key business risks are identified, evaluated and managed by operating management on an ongoing basis by means of procedures such as physical controls, credit and other authorisation limits and segregation of duties. The Board also receives regular reports on any risk matters that need to be brought to its attention. Significant risks identified in connection with the development of new activities are subject to consideration by the Board. There are budgeting procedures in place and reports are presented regularly to the Board detailing the results of each principal business unit, variances against budget and prior year, and other performance data.
The principal non-operational risks inherent in the Group's business are credit, macroeconomic, market, liquidity and capital.
Credit risk
The Company and Group take on exposure to credit risk, which is the risk that a counterparty will be unable to pay amounts in full when due. Significant changes in the economy, or in the health of a particular industry segment that represents a concentration in the Company and Group's portfolio, could result in losses that are different from those provided for at the balance sheet date. Credit risk is managed through the Credit Committee of the banking subsidiary.
The Committee regularly reviews the credit risk profile of the Group, with a clear focus on performance against risk appetite statements and risk metrics. The Committee considered credit conditions during the period.
The Company and Group structure the levels of credit risk it undertakes by placing limits on the amount of risk accepted in relation to products, and one borrower or groups of borrowers. Such risks are monitored on a revolving basis and subject to an annual or more frequent review. The limits are approved periodically by the Board of Directors and actual exposures against limits are monitored daily.
Exposure to credit risk is managed through regular analysis of the ability of borrowers and potential borrowers to meet interest and capital repayment obligations and by changing these lending limits where appropriate. Exposure to credit risk is also managed in part by obtaining collateral, and corporate and personal guarantees.
The Group has attempted to leverage stress test modelling insights to inform ECL model refinements to enable reasonable estimates. Management review of modelling approaches and outcomes continues to inform any necessary adjustments to the ECL estimates through the form of in-model adjustments, based on expert judgement including the use of available information. Management considerations included the potential severity and duration of the economic shock, including the mitigating effects of government support actions, as well the potential trajectory of the subsequent recovery.
The Group employs a range of policies and practices to mitigate credit risk. The most traditional of these is the taking of collateral to secure advances, which is common practice. The principal collateral types for loans and advances include, but are not limited to:
• Charges over residential and commercial properties;
• Charges over business assets such as premises, inventory and accounts receivable;
• Charges over financial instruments such as debt securities and equities;
• Charges over other chattels; and
• Personal guarantees
Upon initial recognition of loans and advances, the fair value of collateral is based on valuation techniques commonly used for the corresponding assets. In order to minimise any potential credit loss, the Group will seek additional collateral from the counterparty as soon as impairment indicators are noticed for the relevant individual loans and advances. Repossessed collateral, not readily convertible into cash, is made available for sale in an orderly fashion, with the proceeds used to reduce or repay the outstanding indebtedness, or held as inventory where the Group intends to develop and sell in the future. Where excess funds are available after the debt has been repaid, they are available either for other secured lenders with lower priority or are returned to the customer.
Commitments to extend credit represent unused portions of authorisations to extend credit in the form of loans, guarantees or letters of credit. With respect to credit risk on commitments to extend credit, the Group is potentially exposed to loss in an amount equal to the total unused commitments. However, the likely amount of loss is less than the total unused commitments, as most commitments to extend credit are contingent upon customers maintaining specific credit standards.
The Group incorporates forward-looking information into both its assessment of whether the credit risk of an instrument has increased significantly since its initial recognition and its measurement of ECL. The key inputs into the measurement of the ECL are:
• assessment of significant increase in credit risk
• future economic scenarios
• probability of default
• loss given default
• exposure at default
The IFRS 9 impairment model adopts a three stage approach based on the extent of credit deterioration since origination.
|
The Group's maximum exposure to credit risk before collateral held or other credit enhancements is as follows: |
||||||
|
30 June 2026 |
||||||
|
Group |
Banking |
RAF |
ACABL |
AAG |
All Other Divisions |
Total |
|
Credit risk exposures (all stage 1, unless otherwise stated) |
£000 |
£000 |
£000 |
£000 |
£000 |
£000 |
|
On-balance sheet: |
||||||
|
Cash and balances at central banks |
- |
- |
- |
- |
522,548 |
522,548 |
|
Loans and advances to banks |
- |
- |
- |
- |
61,097 |
61,097 |
|
Debt securities at amortised cost |
- |
- |
- |
- |
2,037,429 |
2,037,429 |
|
Derivative financial instruments |
- |
- |
- |
- |
902 |
902 |
|
Loans and advances to customers (Gross of ECL) |
1,409,188 |
370,446 |
282,389 |
107,644 |
- |
2,169,667 |
|
Stage 1 - Gross amount outstanding |
1,320,860 |
361,367 |
246,054 |
107,150 |
- |
2,035,431 |
|
Stage 2 - Gross amount outstanding |
31,974 |
5,985 |
36,335 |
13 |
- |
74,307 |
|
Stage 3 - Gross amount outstanding |
56,354 |
3,094 |
- |
481 |
- |
59,929 |
|
Other assets |
- |
- |
- |
- |
5,580 |
5,580 |
|
Financial investments |
- |
- |
- |
- |
2,071 |
2,071 |
|
Off-balance sheet: |
||||||
|
Guarantees |
4,115 |
- |
- |
- |
- |
4,115 |
|
Loan commitments |
116,399 |
- |
346,468 |
- |
- |
462,867 |
|
At 30 June 2026 |
1,529,702 |
370,446 |
628,857 |
107,644 |
2,629,627 |
5,266,276 |
|
30 June 2025 |
||||||
|
Group |
Banking |
RAF |
ACABL |
AAG |
All Other Divisions |
Total |
|
Credit risk exposures (all stage 1, unless otherwise stated) |
£000 |
£000 |
£000 |
£000 |
£000 |
£000 |
|
On-balance sheet: |
||||||
|
Cash and balances at central banks |
- |
- |
- |
- |
768,640 |
768,640 |
|
Loans and advances to banks |
- |
- |
- |
- |
83,573 |
83,573 |
|
Debt securities at amortised cost |
- |
- |
- |
- |
1,690,403 |
1,690,403 |
|
Derivative financial instruments |
- |
- |
- |
- |
2,030 |
2,030 |
|
Loans and advances to customers (Gross of ECL) |
1,430,741 |
280,553 |
231,211 |
87,955 |
1,156 |
2,031,616 |
|
Stage 1 - Gross amount outstanding |
1,325,043 |
273,520 |
206,284 |
87,751 |
- |
1,892,598 |
|
Stage 2 - Gross amount outstanding |
35,746 |
3,375 |
24,927 |
168 |
- |
64,216 |
|
Stage 3 - Gross amount outstanding |
69,952 |
3,658 |
- |
36 |
1,156 |
74,802 |
|
Other assets |
- |
- |
- |
- |
5,800 |
5,800 |
|
Financial investments |
- |
- |
- |
- |
4,975 |
4,975 |
|
Off-balance sheet: |
||||||
|
Guarantees |
2,425 |
- |
- |
- |
- |
2,425 |
|
Loan commitments |
77,937 |
- |
275,475 |
- |
- |
353,412 |
|
At 30 June 2025 |
1,511,103 |
280,553 |
506,686 |
87,955 |
2,556,577 |
4,942,874 |
|
31 December 2025 |
||||||
|
Group |
Banking |
RAF |
ACABL |
AAG |
All Other Divisions |
Total |
|
Credit risk exposures (all stage 1, unless otherwise stated) |
£000 |
£000 |
£000 |
£000 |
£000 |
£000 |
|
On-balance sheet: |
||||||
|
Cash and balances at central banks |
- |
- |
- |
- |
437,548 |
437,548 |
|
Loans and advances to banks |
- |
- |
- |
- |
117,497 |
117,497 |
|
Debt securities at amortised cost |
- |
- |
- |
- |
2,033,158 |
2,033,158 |
|
Derivative financial instruments |
- |
- |
- |
- |
1,398 |
1,398 |
|
Loans and advances to customers (Gross of ECL) |
1,367,125 |
288,308 |
219,536 |
97,586 |
1,148 |
1,973,703 |
|
Stage 1 - Gross amount outstanding |
1,288,927 |
280,720 |
189,554 |
97,454 |
(12) |
1,856,643 |
|
Stage 2 - Gross amount outstanding |
18,413 |
4,888 |
29,982 |
100 |
- |
53,383 |
|
Stage 3 - Gross amount outstanding |
59,785 |
2,700 |
- |
32 |
1,160 |
63,677 |
|
Other assets |
- |
- |
- |
- |
7,011 |
7,011 |
|
Financial investments |
- |
- |
- |
- |
2,061 |
2,061 |
|
Off-balance sheet: |
||||||
|
Guarantees |
3,059 |
- |
- |
- |
- |
3,059 |
|
Loan commitments |
74,457 |
- |
300,835 |
- |
- |
375,292 |
|
At 31 December 2025 |
1,444,641 |
288,308 |
520,371 |
97,586 |
2,599,821 |
4,950,727 |
|
The tables below show the Group's expected credit loss (ECL), by segment and stage: |
||||||
|
30 June 2026 |
||||||
|
Group |
Banking |
RAF |
ACABL |
AAG |
All Other Divisions |
Total |
|
ECL provisions |
£000 |
£000 |
£000 |
£000 |
£000 |
£000 |
|
Stage 1 |
(391) |
(63) |
(230) |
(234) |
- |
(918) |
|
Stage 2 |
- |
(66) |
(10) |
- |
- |
(76) |
|
Stage 3 |
(11,909) |
(957) |
- |
- |
- |
(12,866) |
|
At 30 June 2026 |
(12,300) |
(1,086) |
(240) |
(234) |
- |
(13,860) |
|
|
|
|
|
|
|
|
|
30 June 2025 |
||||||
|
Group |
Banking |
RAF |
ACABL |
AAG |
All Other Divisions |
Total |
|
ECL provisions |
£000 |
£000 |
£000 |
£000 |
£000 |
£000 |
|
Stage 1 |
(384) |
(67) |
(43) |
(305) |
- |
(799) |
|
Stage 2 |
(7) |
(51) |
(10) |
- |
- |
(68) |
|
Stage 3 |
(10,513) |
(719) |
- |
(1) |
(258) |
(11,491) |
|
At 30 June 2025 |
(10,904) |
(837) |
(53) |
(306) |
(258) |
(12,358) |
|
31 December 2025 |
||||||
|
Group |
Banking |
RAF |
ACABL |
AAG |
All Other Divisions |
Total |
|
ECL provisions |
£000 |
£000 |
£000 |
£000 |
£000 |
£000 |
|
Stage 1 |
(440) |
(46) |
(93) |
(128) |
- |
(707) |
|
Stage 2 |
(4) |
(87) |
(81) |
- |
- |
(172) |
|
Stage 3 |
(10,745) |
(1,096) |
- |
(4) |
(439) |
(12,284) |
|
At 31 December 2025 |
(11,189) |
(1,229) |
(174) |
(132) |
(439) |
(13,163) |
Capital management
During the period all regulated entities have complied with all of the externally imposed capital requirements to which they are subject. The capital position of the Group remains strong. The Total Capital Requirement Ratio ("TCR") is 8.05% (30 June 2025: 8.32%; 31 December 2025: 8.05%), while the CET1 capital ratio is 12.0% (30 June 2025: 12.7%; 31 December 2025: 13.3%) and the total capital ratio is 13.9% (30 June 2025: 14.8%; 31 December 2025: 15.4%).
Valuation of financial instruments
The Group measures the fair value of an instrument using quoted prices in an active market for that instrument. A market is regarded as active if quoted prices are readily and regularly available and represent actual and regularly occurring market transactions. If a market for a financial instrument is not active, the Group establishes fair value using a valuation technique. These include the use of recent arm's length transactions, reference to other instruments that are substantially the same for which market observable prices exist, net present value and discounted cash flow analysis. The objective of valuation techniques is to determine the fair value of the financial instrument at the reporting date as the price that would be received to sell an asset or paid to transfer a liability in an orderly transaction between market participants. In the event that fair values of assets and liabilities cannot be reliably measured, they are carried at cost.
The Group measures fair value using the following fair value hierarchy that reflects the significance of the inputs used in making measurements:
|
• |
Level 1: Quoted prices in active markets for identical assets or liabilities. |
|
• |
Level 2: Inputs other than quoted prices included within Level 1 that are observable for the asset or liability, either directly (i.e. as prices) or indirectly (i.e. derived from prices). This category includes instruments valued using: quoted market prices in active markets for similar instruments; quoted prices for identical or similar instruments in markets that are considered less than active; or other valuation techniques in which all significant inputs are directly or indirectly observable from market data. |
|
• |
Level 3: Inputs that are unobservable. This category includes all instruments for which the valuation technique includes inputs not based on observable data and the unobservable inputs have a significant effect on the instrument's valuation. This category includes instruments that are valued based on quoted prices for similar instruments for which significant unobservable adjustments or assumptions are required to reflect differences between the instruments. |
The consideration of factors such as the magnitude and frequency of trading activity, the availability of prices and the size of bid/offer spreads assists in the judgement as to whether a market is active. If in the opinion of management, a significant proportion of the instrument's carrying amount is driven by unobservable inputs, the instrument in its entirety is classified as valued using significant unobservable inputs. 'Unobservable' in this context means that there is little or no current market data available from which to determine the level at which an arm's length transaction would be likely to occur. It generally does not mean that there is no market data available at all upon which to base a determination of fair value (consensus pricing data may, for example, be used).
The tables below analyse financial instruments measured at fair value by the level in the fair value hierarchy into which the measurement is categorised:
|
Level 1 |
Level 2 |
Level 3 |
Total |
|
|
At 30 June 2026 |
£000 |
£000 |
£000 |
£000 |
|
ASSETS |
||||
|
Derivative financial instruments |
- |
902 |
- |
902 |
|
Financial investments |
- |
- |
2,071 |
2,071 |
|
- |
902 |
2,071 |
2,973 |
|
Level 1 |
Level 2 |
Level 3 |
Total |
|
|
At 30 June 2025 |
£000 |
£000 |
£000 |
£000 |
|
ASSETS |
||||
|
Derivative financial instruments |
- |
2,030 |
- |
2,030 |
|
Financial investments |
- |
- |
4,975 |
4,975 |
|
- |
2,030 |
4,975 |
7,005 |
|
Level 1 |
Level 2 |
Level 3 |
Total |
|
|
At 31 December 2025 |
£000 |
£000 |
£000 |
£000 |
|
ASSETS |
||||
|
Derivative financial instruments |
- |
1,398 |
- |
1,398 |
|
Financial investments |
- |
- |
2,061 |
2,061 |
|
- |
1,398 |
2,061 |
3,459 |
|
There were no transfers between level 1 and level 2 during the period. |
||||
|
For assets which are accounted at fair value under Level 3 the valuations are primarily based on Fund Manager valuations and are based on reasonable estimates. Changing one or more of the unobservable inputs to reflect reasonably possible alternative assumptions would not lead to a significantly different fair value. The following table reconciles the movement in level 3 financial instruments measured at fair value during the year: |
||||
|
At 30 June |
At 30 June |
At 31 December |
||
|
2026 |
2025 |
2025 |
||
|
Movement in level 3 |
£000 |
£000 |
£000 |
|
|
At 1 January |
2,061 |
4,947 |
4,947 |
|
|
Acquisitions |
12 |
6 |
131 |
|
|
Disposals |
- |
- |
(2,958) |
|
|
Movements recognised in Other Comprehensive Income |
(2) |
22 |
(59) |
|
|
At 30 June / 31 December |
2,071 |
4,975 |
2,061 |
|
The tables below show the fair value of financial instruments carried at amortised cost by the level in the fair value hierarchy:
|
Level 1 |
Level 2 |
Level 3 |
Total |
|
|
At 30 June 2026 |
£000 |
£000 |
£000 |
£000 |
|
ASSETS |
||||
|
Cash and balances at central banks |
- |
522,548 |
- |
522,548 |
|
Loans and advances to banks |
- |
61,097 |
- |
61,097 |
|
Debt securities at amortised cost |
- |
2,037,512 |
- |
2,037,512 |
|
Loans and advances to customers |
- |
- |
2,159,161 |
2,159,161 |
|
Other assets |
- |
- |
5,580 |
5,580 |
|
- |
2,621,157 |
2,164,741 |
4,785,898 |
|
|
LIABILITIES |
|
|
|
|
|
Deposits from banks |
- |
21,094 |
- |
21,094 |
|
Deposits from customers |
- |
4,775,439 |
- |
4,775,439 |
|
Other liabilities |
- |
- |
28,744 |
28,744 |
|
Debt securities in issue |
- |
- |
38,526 |
38,526 |
|
- |
4,796,533 |
67,270 |
4,863,803 |
|
Level 1 |
Level 2 |
Level 3 |
Total |
|
|
At 30 June 2025 |
£000 |
£000 |
£000 |
£000 |
|
ASSETS |
||||
|
Cash and balances at central banks |
- |
768,724 |
- |
768,724 |
|
Loans and advances to banks |
- |
83,573 |
- |
83,573 |
|
Debt securities at amortised cost |
- |
1,691,397 |
- |
1,691,397 |
|
Loans and advances to customers |
- |
- |
2,014,780 |
2,014,780 |
|
Other assets |
- |
- |
5,800 |
5,800 |
|
- |
2,543,694 |
2,020,580 |
4,564,274 |
|
|
LIABILITIES |
|
|
|
|
|
Deposits from banks |
- |
196,965 |
- |
196,965 |
|
Deposits from customers |
- |
4,418,019 |
- |
4,418,019 |
|
Other liabilities |
- |
- |
40,755 |
40,755 |
|
Debt securities in issue |
- |
- |
38,392 |
38,392 |
|
- |
4,614,984 |
79,147 |
4,694,131 |
|
Level 1 |
Level 2 |
Level 3 |
Total |
|
|
At 31 December 2025 |
£000 |
£000 |
£000 |
£000 |
|
ASSETS |
||||
|
Cash and balances at central banks |
- |
437,548 |
- |
437,548 |
|
Loans and advances to banks |
- |
117,497 |
- |
117,497 |
|
Debt securities at amortised cost |
- |
2,034,512 |
- |
2,034,512 |
|
Loans and advances to customers |
- |
- |
1,963,911 |
1,963,911 |
|
Other assets |
- |
- |
7,011 |
7,011 |
|
- |
2,589,557 |
1,970,922 |
4,560,479 |
|
|
LIABILITIES |
|
|
|
|
|
Deposits from banks |
- |
1,389 |
- |
1,389 |
|
Deposits from customers |
- |
4,570,365 |
- |
4,570,365 |
|
Other liabilities |
- |
- |
20,493 |
20,493 |
|
Debt securities in issue |
- |
- |
38,672 |
38,672 |
|
- |
4,571,754 |
59,165 |
4,630,919 |
All above assets and liabilities are carried at amortised cost. Therefore, for these assets, the fair value hierarchy noted above relates to the disclosure in this note only.
Cash and balances at central banks
The fair value of cash and balances at central banks was calculated based upon the present value of the expected future principal and interest cash flows. The rate used to discount the cash flows was the market rate of interest at the balance sheet date.
At the end of each period, the fair value of cash and balances at central banks was calculated to be equivalent to their carrying value.
Loans and advances to banks
The fair value of loans and advances to banks was calculated based upon the present value of the expected future principal and interest cash flows. The rate used to discount the cash flows was the market rate of interest at the balance sheet date.
Loans and advances to customers
The fair value of loans and advances to customers was calculated based upon the present value of the expected future principal and interest cash flows. The rate used to discount the cash flows was the market rate of interest at the balance sheet date, and the same assumptions regarding the risk of default were applied as those used to derive the carrying value.
The Group provides loans and advances to commercial, corporate and personal customers at both fixed and variable rates. To determine the fair value of loans and advances to customers, loans are segregated into portfolios of similar characteristics. A number of techniques are used to estimate the fair value of fixed rate lending; these take account of expected credit losses based on historic trends and expected future cash flows.
For the acquired loan book, the discount on acquisition is used to determine the fair value in addition to the expected credit losses and expected future cash flows.
Debt securities at amortised cost
The fair value of debt securities is based on the quoted mid-market share price.
Derivatives
Where derivatives are traded on an exchange, the fair value is based on prices from the exchange.
Deposits from banks
The fair value of amounts due to banks was calculated based upon the present value of the expected future principal and interest cash flows. The rate used to discount the cash flows was the market rate of interest at the balance sheet date.
At the end of each period, the fair value of amounts due to banks was calculated to be equivalent to their carrying value due to the short maturity term of the amounts due.
Deposits from customers
The fair value of deposits from customers was calculated based upon the present value of the expected future principal and interest cash flows. The rate used to discount the cash flows was the market rate of interest at the balance sheet date for the notice deposits and deposit bonds. The fair value of instant access deposits is equal to book value as they are repayable on demand.
Financial liabilities
The fair value of other financial liabilities was calculated based upon the present value of the expected future principal cash flows.
At the end of each period, the fair value of other financial liabilities was calculated to be equivalent to their carrying value due to their short maturity. The other financial liabilities include all other liabilities other than non-interest accruals.
Subordinated liabilities
The fair value of subordinated liabilities was calculated based upon the present value of the expected future principal cash flows.
5. Operating segments
The Group is organised into seven operating segments as disclosed below:
|
1) |
Banking - Includes Private and Commercial Banking. Private Banking - Provides traditional private banking services. Commercial Banking - Provides bespoke commercial banking services and tailored secured lending against property investments and other assets. The acquired mortgage portfolio is also included in Banking. |
|
2) |
Wealth Management - Offering financial planning and investment management services. |
|
3) |
RAF - Specialist asset finance lender mainly in high value cars but also business assets. |
|
4) |
ACABL - Provides finance secured on either invoices, assets or stock of the borrower. |
|
5) |
AAG - Provides vehicle finance and related services, predominantly in the truck & trailer and bus & coach markets. |
|
6) |
All Other Divisions - All other smaller divisions and central costs in Arbuthnot Latham & Co., Ltd (Investment property and Central costs). |
|
7) |
Group Centre - ABG Group management. |
Transactions between the operating segments are on normal commercial terms. Centrally incurred expenses are charged to operating segments on an appropriate pro-rata basis. Segment assets and liabilities comprise loans and advances to customers and customer deposits, being the majority of the balance sheet.
|
|
||||||||
|
Banking |
Wealth Management |
RAF |
ACABL |
AAG |
All Other Divisions |
Group Centre |
Total |
|
|
Six months ended 30 June 2026 |
£000 |
£000 |
£000 |
£000 |
£000 |
£000 |
£000 |
£000 |
|
|
||||||||
|
Interest revenue |
40,162 |
- |
12,795 |
9,495 |
3,624 |
48,674 |
1,788 |
116,538 |
|
Inter-segment revenue |
- |
- |
- |
- |
- |
- |
(1,788) |
(1,788) |
|
Interest revenue from external customers |
40,162 |
- |
12,795 |
9,495 |
3,624 |
48,674 |
- |
114,750 |
|
Fee and commission income |
3,062 |
9,264 |
70 |
3,908 |
- |
1,021 |
- |
17,325 |
|
Revenue |
- |
- |
- |
- |
56,990 |
- |
- |
56,990 |
|
Revenue from external customers |
43,224 |
9,264 |
12,865 |
13,403 |
60,614 |
49,695 |
- |
189,065 |
|
Interest expense |
6,972 |
523 |
(4,402) |
(5,624) |
(6,043) |
(46,606) |
(1,787) |
(56,967) |
|
Cost of goods sold |
- |
- |
- |
- |
(45,106) |
- |
- |
(45,106) |
|
Add back inter-segment revenue |
- |
- |
- |
- |
- |
- |
1,788 |
1,788 |
|
Fee and commission expense |
(492) |
2 |
(11) |
- |
(6) |
(51) |
- |
(558) |
|
Segment operating income |
49,704 |
9,789 |
8,452 |
7,779 |
9,459 |
3,038 |
1 |
88,222 |
|
Impairment losses |
(1,282) |
- |
(356) |
(66) |
(153) |
23 |
- |
(1,834) |
|
Other income |
- |
- |
- |
- |
231 |
620 |
- |
851 |
|
Operating expenses |
(38,458) |
(10,240) |
(4,247) |
(3,454) |
(8,699) |
(5,733) |
(5,370) |
(76,201) |
|
Segment profit / (loss) before tax |
9,964 |
(451) |
3,849 |
4,259 |
838 |
(2,052) |
(5,369) |
11,038 |
|
Income tax (expense) / income |
- |
- |
(967) |
(1,069) |
(255) |
1,407 |
(2,018) |
(2,902) |
|
Segment profit / (loss) after tax |
9,964 |
(451) |
2,882 |
3,190 |
583 |
(645) |
(7,387) |
8,136 |
|
|
||||||||
|
Loans and advances to customers |
1,396,888 |
- |
369,361 |
282,149 |
107,410 |
- |
- |
2,155,808 |
|
Assets available for lease |
- |
- |
- |
- |
290,488 |
- |
- |
290,488 |
|
Other assets |
- |
- |
- |
- |
- |
2,793,035 |
(11,230) |
2,781,805 |
|
Segment total assets |
1,396,888 |
- |
369,361 |
282,149 |
397,898 |
2,793,035 |
(11,230) |
5,228,101 |
|
Customer deposits |
4,775,439 |
- |
- |
- |
- |
- |
- |
4,775,439 |
|
Other liabilities |
- |
- |
- |
- |
- |
179,243 |
(6,055) |
173,188 |
|
Segment total liabilities |
4,775,439 |
- |
- |
- |
- |
179,243 |
(6,055) |
4,948,627 |
|
Other segment items: |
|
|||||||
|
Capital expenditure |
- |
- |
(234) |
- |
(50,017) |
(1,327) |
(11) |
(51,589) |
|
Depreciation and amortisation |
- |
- |
(151) |
- |
(28,698) |
(2,681) |
(15) |
(31,545) |
|
The "Group Centre" segment above includes the parent entity and all intercompany eliminations. |
||||||||
|
Banking |
Wealth Management |
RAF |
ACABL |
AAG |
All Other Divisions |
Group Centre |
Total |
|
|
Six months ended 30 June 2025 |
£000 |
£000 |
£000 |
£000 |
£000 |
£000 |
£000 |
£000 |
|
Interest revenue |
50,251 |
- |
11,241 |
9,821 |
2,803 |
51,097 |
- |
125,213 |
|
Interest revenue from external customers |
50,251 |
- |
11,241 |
9,821 |
2,803 |
51,097 |
- |
125,213 |
|
Fee and commission income |
2,541 |
7,844 |
43 |
3,790 |
- |
943 |
- |
15,161 |
|
Revenue |
- |
- |
- |
- |
57,146 |
- |
- |
57,146 |
|
Revenue from external customers |
52,792 |
7,844 |
11,284 |
13,611 |
59,949 |
52,040 |
- |
197,520 |
|
Interest expense |
(248) |
324 |
(3,692) |
(5,430) |
(6,812) |
(50,635) |
- |
(66,493) |
|
Cost of goods sold |
- |
- |
- |
- |
(45,556) |
- |
- |
(45,556) |
|
Fee and commission expense |
(173) |
(59) |
(10) |
- |
(9) |
(331) |
- |
(582) |
|
Segment operating income |
52,371 |
8,109 |
7,582 |
8,181 |
7,572 |
1,074 |
- |
84,889 |
|
Impairment losses |
(962) |
- |
(504) |
259 |
(83) |
(150) |
- |
(1,440) |
|
Other income |
- |
- |
- |
- |
16 |
708 |
- |
724 |
|
Operating expenses |
(36,949) |
(10,045) |
(3,798) |
(3,673) |
(8,022) |
(5,441) |
(5,391) |
(73,319) |
|
Segment profit / (loss) before tax |
14,460 |
(1,936) |
3,280 |
4,767 |
(517) |
(3,809) |
(5,391) |
10,854 |
|
Income tax (expense) / income |
- |
- |
(827) |
(1,199) |
82 |
174 |
(2,146) |
(3,916) |
|
Segment profit / (loss) after tax |
14,460 |
(1,936) |
2,453 |
3,568 |
(435) |
(3,635) |
(7,537) |
6,938 |
|
|
||||||||
|
Loans and advances to customers |
1,419,837 |
- |
279,716 |
231,158 |
87,649 |
898 |
- |
2,019,258 |
|
Assets available for lease |
- |
- |
- |
- |
297,330 |
- |
- |
297,330 |
|
Other assets |
- |
- |
- |
- |
- |
2,718,605 |
(8,580) |
2,710,025 |
|
Segment total assets |
1,419,837 |
- |
279,716 |
231,158 |
384,979 |
2,719,503 |
(8,580) |
5,026,613 |
|
Customer deposits |
4,418,019 |
- |
- |
- |
- |
- |
- |
4,418,019 |
|
Other liabilities |
- |
- |
- |
- |
- |
341,913 |
(2,495) |
339,418 |
|
Segment total liabilities |
4,418,019 |
- |
- |
- |
- |
341,913 |
(2,495) |
4,757,437 |
|
Other segment items: |
|
|||||||
|
Capital expenditure |
- |
- |
(3) |
- |
(50,892) |
(2,051) |
- |
(52,946) |
|
Depreciation and amortisation |
- |
- |
(68) |
- |
(28,608) |
(3,479) |
(15) |
(32,170) |
Segment profit is shown prior to any intra-group eliminations.
6. Other income
Other income includes rental income from the investment property of £0.2m (H1 2025: £0.2m).
7. Earnings per ordinary share
Basic
Basic earnings per ordinary share are calculated by dividing the profit after tax attributable to equity holders of the Company by the weighted average number of ordinary shares 16,319,926 (2025: 16,319,926) in issue during the period.
Diluted
Diluted earnings per ordinary share are calculated by dividing the dilutive profit after tax attributable to equity holders of the Company by the weighted average number of ordinary shares in issue during the period, as well as the number of dilutive share options in issue during the period. There were no dilutive share options in issue at the end of June (2025: nil).
|
Six months ended 30 June |
Six months ended 30 June |
|
|
2026 |
2025 |
|
|
Profit attributable |
£000 |
£000 |
|
Total profit after tax attributable to equity holders of the Company |
8,136 |
6,938 |
|
Six months ended 30 June |
Six months ended 30 June |
|
|
2026 |
2025 |
|
|
Basic Earnings per share |
p |
p |
|
Total Basic Earnings per share |
49.9 |
42.5 |
|
8. Share capital and share premium |
|
||
|
30 Jun 2026 |
30 Jun 2025 |
||
|
£000 |
£000 |
||
|
Share capital |
167 |
167 |
|
|
Share premium |
11,606 |
11,606 |
|
|
Share capital and share premium |
11,773 |
11,773 |
|
|
Ordinary share capital |
|
||
|
Number of shares |
Share Capital |
||
|
£000 |
|||
|
At 1 January 2026 |
16,576,619 |
166 |
|
|
At 30 June 2026 |
16,576,619 |
166 |
|
|
Ordinary non-voting share capital |
|
||
|
Number of shares |
Share Capital |
||
|
£000 |
|||
|
At 1 January 2026 |
152,621 |
1 |
|
|
At 30 June 2026 |
152,621 |
1 |
|
|
Total share capital |
|
||
|
Number of shares |
Share Capital |
||
|
£000 |
|||
|
At 1 January 2026 |
16,729,240 |
167 |
|
|
At 30 June 2026 |
16,729,240 |
167 |
(a) Share issue costs
Incremental costs directly attributable to the issue of new shares or options by the Company are shown in equity as a deduction, net of tax, from the proceeds.
(b) Dividends on ordinary shares
Dividends on ordinary shares are recognised in equity in the period in which they are approved.
(c) Share buybacks
Where any Group company purchases the Company's equity share capital (treasury shares), the consideration paid, including any directly attributable incremental costs (net of income taxes) is deducted from equity attributable to the Company's equity holders until the shares are cancelled or reissued.
The Ordinary shares have a par value of 1p per share (2025: 1p per share). At 30 June 2026 the Company held 409,314 shares (2025: 409,314) in treasury. This includes 390,274 (2025: 390,274) Ordinary shares and 19,040 (2025: 19,040) Ordinary Non-Voting shares.
9. Events after the balance sheet date
There were no material post balance sheet events to report.
This information is provided by RNS, the news service of the London Stock Exchange. RNS is approved by the Financial Conduct Authority to act as a Primary Information Provider in the United Kingdom. Terms and conditions relating to the use and distribution of this information may apply. For further information, please contact rns@lseg.com or visit www.rns.com.
RNS may use your IP address to confirm compliance with the terms and conditions, to analyse how you engage with the information contained in this communication, and to share such analysis on an anonymised basis with others as part of our commercial services. For further information about how RNS and the London Stock Exchange use the personal data you provide us, please see our Privacy Policy.
ENDRNS may use your IP address to confirm compliance with the terms and conditions, to analyse how you engage with the information contained in this communication, and to share such analysis on an anonymised basis with others as part of our commercial services. For further information about how RNS and the London Stock Exchange use the personal data you provide us, please see our Privacy Policy.