
Interim Results for six months ended 30 June 2026

India Capital Growth Fund Limited
24 September 2026
INDIA CAPITAL GROWTH FUND LIMITED
Interim Results for the six months ended 30 June 2026
24 September 2026, London - India Capital Growth Fund ("ICGF" or "the Company"), the LSE premium listed investment company established to take advantage of long-term investment opportunities in companies based in India, today reports results for the six months ended 30 June 2026.
|
Financial Highlights |
(Unaudited) |
% change |
(Audited) |
(Unaudited) |
|
|
6 months |
|
12 months |
6 months |
|
|
30 June |
|
31 December |
30 June |
|
|
2026 |
|
2025 |
2025 |
|
|
|
|
|
|
|
Net Asset Value (NAV) total return |
3.1% |
|
-10.4% |
-9.3% |
|
Share price total return |
1.8% |
|
-11.7% |
-9.6% |
|
Share price discount to NAV (Discount) |
10.4% |
|
9.2% |
8.2% |
|
Average month end Discount for the period |
11.0% |
|
8.0% |
7.9% |
|
|
|
|
|
|
|
Per Ordinary Share |
|
|
|
|
|
Net Asset Value (NAV) |
193.17p |
3.1% |
187.29p |
189.58p |
|
Share price |
173.00p |
1.8% |
170.00p |
174.00p |
|
FX impact |
|
|
|
|
|
Indian Rupee (INR) / Sterling (GBP) |
125.13 |
-3.4% |
121.02 |
117.47 |
The NAV per share finished the six-month period up 3.1% and the share price similarly up 1.8%.
- The Discount over the six-month period ranged from a month end Discount between 9.8% and 13.3% and an average of 11%.
- The INR weakened by 3.4% against GBP over the six months to 30 June 2026, contributing to a reduction in the Company's NAV when translated into sterling.
- The Board monitors the discount closely and has the necessary permissions to repurchase stock if the Board decides it is in the best interests of the Company and its shareholders. 1,749,500 shares at an average cost of 155.92p per share were purchased in the six month period to 30 June 2026.
- The Company has declared its first interim dividend of 1.9p per Ordinary Share, payable on 30 October 2026.
Elisabeth Scott, Chair of India Capital Growth Fund, said:
"Despite heightened geopolitical uncertainty and subdued international investor sentiment towards India, the Company delivered positive NAV and share price returns in the first half of 2026 and outperformed its benchmark. The Board remains optimistic about the long-term prospects for India, where improving valuations and historically low levels of foreign investor participation provide a compelling backdrop for future growth. Reflecting this confidence, the Board is pleased to announce the Company's first interim dividend under its new dividend policy."
ENQUIRIES
|
LionTrust, Investment Manager Lucy Draper, Robin Sellers
|
|
|
Shore Capital, Financial Adviser and Broker
Gillian Martin, Daphne Zhang (Corporate Advisory)
|
|
|
Apex Fund and Corporate Services (Guernsey) Limited
(Company Secretary) |
|
About India Capital Growth Fund
India Capital Growth Fund Limited the London Stock Exchange's Main Market listed investment company registered and incorporated in Guernsey, was established to take advantage of long-term investment opportunities in companies based in India. ICGF predominantly invests in listed mid and small cap companies, although investments may also be made in large cap and private Indian companies where the Fund Manager believes long-term capital appreciation will be achieved. www.indiacapitalgrowth.com
Highlights
Financial highlights for the period from 1 January to 30 June 2026
3.1% - NAV per share total return
The Company's NAV per share total return was +3.1% for the period (six months to 30 June 2025: -9.3%), compared with +0.9% for the MSCI India SMID Cap Index (six months to 30 June 2025: -8.3%). Performance was therefore ahead of the benchmark over the six-month period.
1.8% - Shareholder total return
The shareholder total return was +1.8% for the period (six months to 30 June 2025: -9.6%). The Company's share price was 173.0p at 30 June 2026 (30 June 2025: 174.0p).
10.4% - Discount to NAV at period end
The Company's shares ended the period trading at a 10.4% discount to NAV (30 June 2025: 8.2%). The average month-end discount during the period was 11.0% (six months to 30 June 2025: 7.9%).
-3.4% - Movement in the Indian Rupee against Sterling
The Indian Rupee (INR) weakened by 3.4% against Sterling (GBP) during the period (six months to 30 June 2025: -9.3%). The INR/GBP exchange rate on 30 June 2026 was 125.13 (30 June 2025: 117.47).
The NAV per share total return is the theoretical return to shareholders calculated on a per share basis based upon the increase or decrease in the NAV over the relevant period. The MSCI India SMID Cap Index return is based upon the increase or decrease in the published Index converted to GBP over the relevant period.
The shareholder total return is the theoretical return to shareholders calculated on a per share basis based upon the increase or decrease in the share price over the relevant period.
The discount is shown as a percentage to NAV and is calculated based upon the difference between the Company's NAV and share price. The average discount is based upon the published month end discount for the six month period.
The majority of the Company's assets and investments are held in INR whereas the currency of the Company's NAV is GBP. Consequently, any increase or decrease in the value of INR compared to GBP will respectively have a positive or negative impact on the Company's NAV. The Company's long-standing policy is not to hedge the GBP value of its INR assets and investments.
Chair’s Statement
India was not at the forefront of investors’ minds in the first half of 2026. Stock markets have been focused on the rapid growth of AI, and the immediate beneficiaries of that growth, and are anxious about the impact of rising energy prices which are a consequence of the war in the Middle East. Indian companies are not regarded as leaders in the AI sector while international investors are concerned that India is negatively affected by rising energy prices.
Performance
After a torrid year in 2025, your Company’s share price increased by 1.8% during the first half of the year while the underlying Net Asset Value (NAV) rose by 3.1%. While this gain may feel somewhat meagre, it compares well with the Company’s benchmark, the MSCI India SMID Cap Index which rose by 0.9%. Performance in Sterling terms was hampered by a 3.4% decline in the Indian Rupee against the Sterling.
In this report our Fund Advisor, Gaurav Narain, provides a clear explanation of events affecting the Indian economy, the currency and the market, along with a discussion of the key drivers behind your Company’s performance.Key highlights that I have drawn from his report are the divergence between the initial expectations of the impact of the war in the Middle East and the actual impact on the Indian economy, which has shown remarkable agility in its ability to adjust its sources of energy supply; the resilience of corporate earnings in the face of considerable disruption; and the large and stable inflows of domestic funds, largely sourced from small retail investors, into the Indian stock market offsetting departing Foreign Direct Investment which now sits at its lowest level for some considerable time.
Discount Management
The discount of the share price to NAV widened slightly from 9.2% at 31 December 2025 to 10.4% at 30 June 2026. The Board monitors the discount/premium closely and has the necessary permissions to repurchase or issue stock if the Board decides it is in the best interests of the Company and its shareholders. During the period 1,749,500 shares were repurchased, representing 2.6% of the Company’s share capital.Between 30 June 2026 and 23September 2026, being the latest practicable date prior to publication of this report, the Company repurchased a further 1,397,000 shares. Discounts generally widened across the sector peer group in the first half of 2026, with all Indian equity trusts trading at a discount to NAV.
Changes to the Company
At the EGM held in March 2026, we asked shareholders to vote for a series of measures that the Board hopes will put your Company in a better position to navigate the choppy environment both for investment trusts as a sector and for Indian trusts in particular. As a consequence, the Company has introduced a five yearly conditional Performance-Related Tender offer for up to 25% of the Company’s issued share capital (this replaces the biennial redemption facility); adopted the MSCI India SMID Cap Index as the performance benchmark; introduced a new dividend policy (more on this below); and introduced a Dividend Reinvestment Plan (DRIP).
Changes to the Investment Manager
In March 2026, it was announced that Liontrust would acquire River Global, the Investment Manager of India Capital Growth Fund. The acquisition was completed on 1 July. The Board welcomes the deeper resources available to the Company as a consequence of the acquisition. There have been no changes to the Fund Advisor team lead by Gaurav Narain, or to the key personnel with whom the Board works closely.
Interim Dividend
The Board is delighted to announce the first interim dividend of 1.9p per share. This will be paid to shareholders on the register on 2 October 2026 and will be paid on 30 October 2026. As I wrote to shareholders in March: it is the Board’s intention to pay an annual dividend equivalent to approximately 2% of the prevailing NAV per share and the Board’s hope that this dividend will increase over time if circumstances permit. The annual dividend for the year will be paid split across two payments, comprising an interim dividend in October and a second interim dividend paid in April.
InvestorRelations
The Board’s focus on ensuring that we communicate with shareholders as effectively as possible remains in place.We were delighted to have the opportunity to meet a number of shareholders at our AGM in June, the second time we have held our AGM in London. Once again, we were grateful to H/Advisors Maitland for hosting us in their spectacular Kings Cross offices, and for providing an excellent Indian buffet after the formal meeting had taken place, and, of course, to Gaurav and the team for providing such an insightful presentation and for bringing some very interesting products from investee companies which we hope shareholders will have enjoyed at home.
We continue to place a great deal of emphasis on expanding the reach of the Company. So far this year, there have been several articles in the press and in the remainder of the year, Gaurav will participate in a number of conferences in the autumn and the Investment Manager hosts regular webinars during the year.
I encourage shareholders who have not yet taken advantage of these webinars to sign up for updates on the India Capital Growth website www.indiacapitalgrowth.com.
Looking Forward
After a difficult eighteen months, the Board is hopeful about the prospects for the Indian economy and for the stock market in India. The valuations of Indian companies, which had been regarded as inflated, are now more reasonable, and with foreign interest in the Indian stock market at such a low level, there is every likelihood that a more positive global environment (when it comes) could result in some upward momentum for the Indian stock market.
Thank you for your support. The Board is confident that the Investment Manager’s strategy and positioning of the portfolio will stand us in good stead.
Investment Manager’s Review
Economy
The first half of 2026 was volatile, but India began the year on a positive note. Government measures to support consumer spending including reductions in direct and indirect taxes and lower interest rates, were starting to yield encouraging results. The earnings downgrade cycle of 2025 appeared to be behind us, consumer spending was recovering, investment was improving, and corporate earnings were expected to return to healthy double-digit growth. Real GDP growth was projected at approximately 7%.
Sentiment received a further boost when India signed a Free Trade Agreement (FTA) with the European Union in January 2026 and, more importantly, an interim trade agreement with the United States in early February 2026. Tariffs on Indian exports to the US fell from 50% to 18%, placing India on a more competitive footing relative to other countries. The agreement also removed a significant source of uncertainty and addressed one of the key overhangs from 2025.
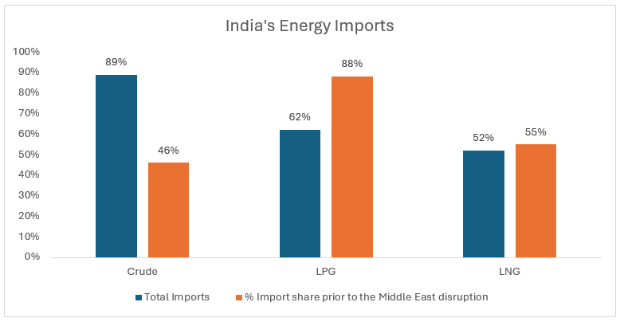
The conflict in the Middle East, which erupted in March, was a major shock. Brent crude prices rose to US$120 per barrel, disproportionately affecting India because of its reliance on energy imports. The country imports more than 85% of its crude oil, over 60% of cooking gas and nearly 50% of natural gas, with a large proportion sourced from the Middle East. Almost overnight, India's strong macroeconomic outlook appeared more vulnerable. The current account deficit, which had been below 1% of GDP, was projected to widen to approximately 2.5%, while inflation expectations rose sharply. The Indian Rupee, which was already under pressure due to significant foreign institutional investor selling, weakened further. In March, the currency depreciated by 2.5% against Sterling and 4.1% against the US Dollar. GDP growth forecasts were revised downward by 1% to reflect these pressures.
The outlook quickly changed from economic recovery to concern that India could be one of the most vulnerable economies. We were also concerned that a prolonged crisis could impact growth because of disruption in supply chains, increases in commodity prices and further currency depreciation. The sustainability of the anticipated earnings upgrade cycle was called into question.
However, developments over the subsequent months have surpassed expectations. Apart from brief shortages of natural gas and fertiliser, there was little disruption to petroleum products. Indian refineries continued to operate normally and remained exporters of refined products. India's energy supplies have also become increasingly diversified. Today, the United States is the largest supplier of natural gas, Russia is the largest supplier of crude oil, and West African nations provide additional supplies. The government increased subsidies in order to slow the increase in consumer gas prices, thereby limiting the inflationary impact on households.
Source: Kotak report, 11 March 2026
At the corporate level, resilience has exceeded expectations. Companies moved swiftly to reconfigure supply chains and implement price increases to offset higher costs. Even businesses selling to other companies were able to pass through cost inflation with limited resistance from customers. More importantly, demand has remained remarkably robust. Four months into the Middle East crisis, demand strengthened rather than weakened. Consumer spending has remained healthy across categories despite widespread price increases, while export-oriented sectors such as auto components and textiles have also reported strong demand.
This resilience was reflected in corporate earnings. The quarter ended June 2026 delivered the strongest results in the last three years. Companies within the Nifty 500 Indian Stock Market Index (NSE 500) (ex. Oil companies) reported revenue growth of about 19% and profit growth above 20%. Some of the revenue growth reflects higher prices, but demand remained resilient despite broad-based price increases making the performance particularly noteworthy.
The primary area of disappointment has been the IT Services sector which has attracted considerable attention amid concerns that Artificial Intelligence (AI) could disrupt its traditional business model. Industry leaders maintain that AI is simply another technology tool to be adopted and that their competitive advantage lies in specialist sector knowledge and client relationships. However, given the rapid pace of AI advancement, the long-term impact remains uncertain.
The IT sector continues to grow, but growth rates have moderated to low single digits. The implications extend beyond corporate earnings. With a workforce approaching six million people, the IT Services industry remains one of India's largest employers. The five largest companies have reduced headcount by approximately 50,000 employees over the last three years. To put this into perspective, these companies hired nearly 270,000 employees in financial year ended March 2022 alone.
Employment generation therefore remains a key priority for policymakers, particularly as approximately eight million young people enter the workforce every year. This has increased the government's focus on expanding India's manufacturing base, both to meet domestic demand and to position the country as a preferred destination for companies seeking to diversify supply chains away from China.
Over the past five years, the government has launched several initiatives to support this objective, with the Production Linked Incentive (PLI) scheme already delivering meaningful results. Since introduction, the scheme has attracted investments of approximately US$ 26bn, generated production worth US$ 230bn, and created over 1.4 million jobs. In the past six months, the government has introduced further initiatives through PLI 2.0, an Electronic Components Manufacturing Scheme (ECMS) and Semicon 2.0. This follows the success of India Semiconductor Mission (Semicon 1.0), under which US$10bn of incentives facilitated the establishment of 12 semiconductor fabrication and packaging facilities.
Together, we believe these developments strengthen the foundations for India's long-term growth and support the sustainability of its economic momentum in the years ahead.
Markets, Flows and Earnings
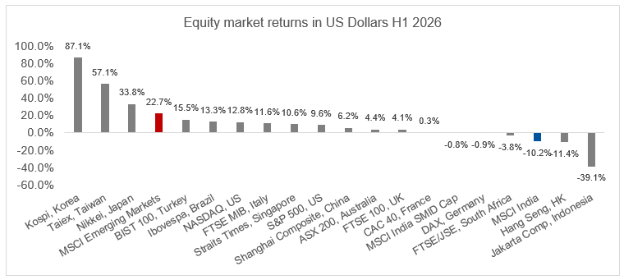
Indian equities continued to underperform global markets during the first half of 2026. The MSCI India Index fell by 10.2%, while the MSCI Emerging Markets Index rose approximately 22.7%, resulting in an underperformance of 32.5%. The MSCI Emerging Markets index was driven largely by a relatively small group of AI and technology related stocks, roughly two thirds of this performance can be attributed to just three stocks, TSMC based in Taiwan and Samsung Electronics and SK Hynix in South Korea.
Unlike the United States, Taiwan and South Korea, India lacks globally significant AI hardware manufacturers, semiconductor companies, or frontier AI model developers. At the same time, concerns regarding the potential disruption of traditional IT Services business models by AI have further weighed on investor sentiment. As a result, some global investors moved capital away from India to markets with greater exposure to AI.
Source: Bloomberg, 31 August 2026
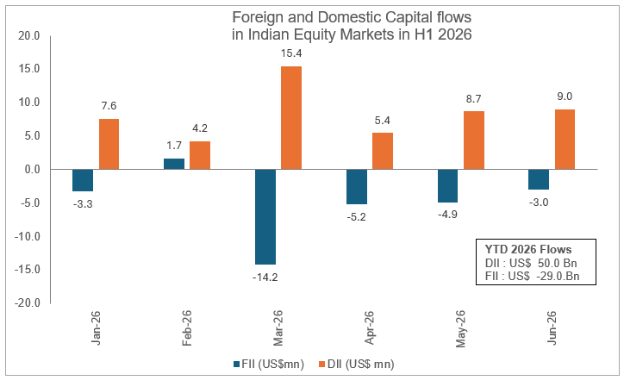
Elevated valuations across sections of the Indian small and mid-cap market created a headwind for performance despite many companies continuing to deliver attractive long-term growth prospects. Foreign Institutional Investors (FIIs) were net sellers of approximately US$28bn during the period.
Geopolitical uncertainty and India's dependence on imported energy added to foreign investors’ concerns. This was reflected in the performance of the currency. During the first half of 2026, the Indian Rupee fell by 5.2% against the US Dollar and 3.4% against Sterling.
This follows declines of 5.0% against the US Dollar and 12.6% against the Sterling during calendar year 2025. Persistent foreign investor outflows also weakened the currency and market sentiment.
In sharp contrast, Domestic Institutional Investors (DIIs) provided strong support to the market with record inflows. During the period, domestic investors deployed approximately US$54bn into equities. Regular monthly investment plans (SIPs) were an important contributor to these flows averaging approximately US$3.4bn per month.
Source: Bloomberg, 31 August 2026
Importantly, these SIP flows appear increasingly structural rather than cyclical. They are being driven by a combination of favourable demographics, rising household incomes, increasing financial literacy, digital adoption, and broader access to investment products. As a result, more household savings are moving into financial investments, particularly in smaller cities and towns, where savings have traditionally been allocated towards real estate and gold.
A notable outcome of the divergence between foreign and domestic investment flows has been the contrasting performance across the market segments. The MSCI India Index, which has significantly higher foreign ownership and a higher proportion of large cap stocks, declined 4.32% (INR) during the six month period, the MSCI SMID Cap index rose.
This pattern is unusual. Typically, periods of heightened uncertainty led investors towards larger, more liquid companies perceived as safer investments. However, the strength of domestic flows has supported broader market participation, particularly within the mid-cap segment, offsetting the impact of foreign selling concentrated in large-cap stocks.
Foreign investors now own approximately 16% of market capitalisation, close to the lowest level in a decade. Most global investors remain underweight India relative to benchmark allocations. This has weighed on market performance over the last 18 months but could also provide a potential source of support going forward. If enthusiasm around AI-related investments eventually normalises and investors broaden their search for growth opportunities, India could once again attract significant foreign capital given its favourable long-term growth outlook and deep corporate opportunity set.
Concern about the weak currency also appears to be moderating. The Reserve Bank of India recently announced a concessional foreign currency swap facility designed to encourage banks to attract Foreign Currency Non-Resident (FCNR) deposits without taking exchange-rate risk. Demand has been exceptionally strong, with inflows expected to reach US$70-80bn.
The success of the programme prompted the RBI to close the facility in August 2026, ahead of its originally scheduled September 2026 deadline. The additional inflows are expected to strengthen India's foreign exchange reserves, improve external stability, and provide greater confidence to global investors at a time of elevated geopolitical and macroeconomic uncertainty.
Overall, market returns have been challenging, but the picture beneath the surface is more encouraging. Corporate earnings have remained resilient, domestic liquidity continues to strengthen, and policy measures are helping reinforce economic stability. Combined with subdued foreign investor positioning, these factors provide a constructive backdrop for Indian equities over the medium term.
India Capital Growth Fund Performance
India Capital Growth Fund invests mainly in high-quality medium and small-sized companies in India. As of 30 June 2026, 62.4% of the portfolio was invested in small-companies, defined as businesses with a market capitalisation below US$4bn, while 31.8% was invested in medium sized companies with market capitalisations between US$4bn and US$11.5bn. The Fund's investment philosophy centres on owning businesses with strong fundamentals, capable management teams and sustainable long-term growth potential.
This philosophy is reflected in the stability of the portfolio. Approximately 60% of holdings have been owned for more than five years, while portfolio turnover remains consistently low. The Fund held 33 companies at the end of the period, reflecting our preference for maintaining a focused portfolio of high-conviction investments.
The Fund delivered strong performance during the period. Its Net Asset Value (NAV) rose by 3.1% in Sterling terms, 2.6 percentage points ahead of the benchmark. In Indian Rupee terms, net asset value rose by 7.0%. Performance varied over the period.
The conditional performance-based tender introduced this year measures performance from 1 January 2026. For the period, the Company's NAV Total Return per Share in Sterling terms, before the impact of Capital Gains Tax, was 3.5%, exceeding the benchmark return by 2.6%.
The portfolio declined 16.9% during the January-March 2026 period amid the sharp market correction triggered by the Middle East conflict. The recovery was equally swift, with the net asset value increasing 24.0% during the March-June 2026 quarter.
Our performance was helped by a combination of strong earnings delivered by portfolio companies and a broader recovery in investor sentiment towards medium and small-cap stocks. Importantly, the earnings resilience of our portfolio holdings reinforced our confidence in the quality of the businesses held by the Fund.
Industrials were the largest contributor to performance, followed by Financial Services, Auto Components and Banks. IT Services, Cement and Digital businesses detracted from returns.
Atlanta Electricals was the standout performer, rising 106% during the period, while Skipper gained 22%. Both companies benefited from favourable industry dynamics in power transmission and distribution. Multi Commodity Exchange increased 27%, driven by elevated trading volumes amid heightened commodity market volatility. RBL Bank and Federal Bank, delivered gains of 17% and 24% respectively, supported by strong earnings growth and improving operating performance.
Among the weaker performers, Persistent Systems fell by 31% and Coforge by 12% as investors focused on potential disruption from Artificial Intelligence. While these concerns have weighed on sentiment across the sector, our assessment remains constructive. Both companies have continued to deliver revenue growth of 20-30% over the past two years, significantly outperforming larger IT services peers. Their smaller size has enabled them to adapt quickly to technological change, launch proprietary AI-based solutions and secure large client engagements centred on AI adoption. We therefore continue to view both businesses favourably from a long-term perspective.
|
Top 5 Holdings by share price return |
Increase in Share price Return % |
|
Atlanta Electricals |
106.3% |
|
Aether Industries |
58.0% |
|
Uniparts India |
39.0% |
|
Sona BLW Precision Forgings |
29.3% |
|
Triveni Turbine |
28.1% |
|
Bottom 5 Holdings by share price return (6 months to 30 June 2026) |
Decrease in Share price Return % |
|
Persistent Systems |
-31.0% |
|
Emami |
-23.5% |
|
JK Lakshmi Cement |
-22.1% |
|
Affle India |
-21.1% |
|
PI Industries |
-21.1% |
Within the Cement sector, our holdings were impacted by cost pressures arising from higher energy and commodity prices following geopolitical disruptions. We expect profitability to improve during the second half of the year as input cost pressures moderate and construction activity accelerates following the monsoon season.
The Fund’s digital holdings also underperformed because of concerns regarding AI-related disruption. However, we believe the market underestimates the extent to which these companies are leveraging AI to enhance their products, improve customer engagement and strengthen their competitive positioning. In our view, AI is an opportunity rather than a threat for these businesses and should support further market share gains over time.
During the period, the Fund increased its exposure to several existing holdings, including Kajaria Ceramics, Skipper, Coforge, EPL, Dixon Technologies, CarTrade Tech Limited, City Union Bank and GPT Healthcare. The increased weightings reflected our conviction in the long-term growth prospects of these businesses and opportunities created by market volatility.
The Fund exited its investment in Jyothy Labs following concerns regarding moderating growth prospects. We also reduced positions in Federal Bank, Multi Commodity Exchange, Neuland Laboratories, CCL Products, Aether Industries, Persistent Systems, Atlanta Electricals, Affle India, Triveni Turbine, Welspun Living and Sona BLW. These transactions primarily reflected portfolio rebalancing and valuation discipline following periods of strong share price performance.
As of 30 June 2026, the Fund held a cash position of 5.8%. We believe maintaining a modest cash balance is prudent in the current environment, providing flexibility to capitalise on attractive opportunities that may arise from market volatility, IPOs or temporary pricing dislocations. We remain focused on identifying high-quality businesses that align with our investment philosophy and can compound shareholder value over the long-term.
Theme: Financial Intermediation
Nuvama Wealth
India’s second-largest independent wealth management company
Nuvama Wealth Management is one of India's leading independent wealth management platforms, managing over US$37bn of client assets across affluent, High-Net-Worth Individual (HNI) and Ultra-High-Net-Worth Individual (UHNI) clients.
Formerly Edelweiss Wealth Management, the company has built an integrated ecosystem spanning wealth management, asset management, capital markets, asset servicing, institutional equities and investment banking. Management views wealth management as a platform business where the key objective is to increase the earning potential of Relationship Managers by expanding the range of solutions offered to clients, allowing Nuvama to capture a larger share of client wallets and strengthen retention.
Unlike traditional private banks or product distributors, Nuvama operates an open-architecture model, offering clients access to the best available third-party products while selectively manufacturing solutions only where market gaps exist. Lending, broking, alternatives, and investment banking are not standalone profit centres but tools that deepen client relationships and improve Relationship Manager productivity. This integrated platform creates a significant competitive advantage, particularly against independent financial advisers and mono-line competitors that lack access to proprietary deal flow, private market opportunities and institutional capabilities. Nuvama's leading asset servicing franchise, together with its institutional equities and investment banking businesses, further reinforces the platform and creates valuable cross-selling opportunities.
The company is a direct beneficiary of India's long-term financialisation trend as household savings increasingly shift from physical assets and deposits towards financial products and professional advice. Management expects Assets Under Management to grow by about 20%, it believes that growth beyond this, risks compromising relationship quality, client outcomes and platform standards.Because Relationship Managers are in short supply, Nuvama prioritises quality and retention over short-term growth. We believe its integrated platform, strong advisory franchise and exposure to structural growth in Indian wealth creation position the company to capture a disproportionate share of India's rapidly expanding wealth management opportunity.
Theme: Infrastructure: Power Capex
Atlanta Electricals
A pure play transformer manufacturer pivoting to High Voltage offerings
India’s power transmission and distribution infrastructure is witnessing a multi-year super cycle underpinned by the aggressive renewable energy integration, grid modernisation and surging data centre demand. Atlanta Electricals has over 30 years of manufacturing experience and pan India presence and has demonstrated a strong foothold in the low and medium voltage transformers class (up to 220kv).
To meet soaring demand, the company has quadrupled its capacities to ~64,000 MVA, creating one of the largest production footprints in India. Crucially about 45,000 MVA (~ approximately 70% of total capacity) will be dedicated towards high voltage offerings (above 220kv).
The high voltage segment is characterized by lengthy customer approval process with extensive product testing and qualification requirements creating significant barriers to entry. As a result, there are fewer competitors and thus structurally superior operating margins.
Atlanta Electricals’ ambitions aren’t just restricted to domestic markets. The management has a clear eye on exports with a target of 15% of FY28 sales coming from them and a longer-term plan of expanding manufacturing footprint in international markets. Given the crunch in the global supply chain because of geopolitics as well as unavailability of components due to the global super cycle, Atlanta Electricals has undertaken backward integration initiatives in critical components such as radiators and fabrication tanks to ensure timely deliveries.
The long-term vision of the company is to become a one stop shop offering electrical solutions such as switchgears, reactors etc and not just transformers. We see Atlanta as being well positioned to capture the power sector tailwinds in this era of global electrification.
Theme: Consumption
EPL Ltd
Building a Global Packaging Leader
EPL Ltd is the world's largest manufacturer of laminated tubes and a leading provider of specialty packaging solutions for global consumer and pharmaceutical brands. Over the years, the company has built an extensive manufacturing footprint with 21 plants across 11 countries and a customer base across geographies making it one of the few truly global players in its industry.
Historically, EPL's core business has been oral care packaging, particularly toothpaste tubes, where it enjoys a market-leading position with close to a 35% global market share. While the oral care segment continues to grow steadily at high single-digit rates, management has successfully diversified the business into higher-growth categories such as Beauty and Cosmetics. This diversification has significantly expanded EPL's addressable market while reducing its dependence on any single end segment.
The Beauty and Cosmetics business has emerged as a particularly attractive growth driver. Unlike oral care, this segment is characterised by lower volumes but significantly higher margins, driven by premium packaging requirements, greater product differentiation and a stronger innovation component. Today, Beauty and Cosmetics contributes more than 50% of EPL's business and continues to grow at approximately 18-20% annually, making it one of the key engines of future growth.
Innovation and sustainability remain at the heart of EPL's strategy. The company has established itself as an industry leader in sustainable packaging, with approximately 44% of its tubes now meeting sustainability criteria. EPL's expertise in recyclable and sustainable packaging solutions positions it favourably to capture incremental demand.
A recent strategic development has been the investment by Indorama Ventures and the proposed integration of its rigid packaging operations with EPL. This expands EPL's product portfolio, opens up a substantially larger packaging market opportunity and further strengthens the company's balance sheet and global capabilities.
EPL has a strong balance sheet with low leverage and operating margins at 18-20%.With a strong position in existing markets, growing exposure to high-margin categories, a leadership position in sustainable packaging and opportunities to add new product segments and geographies, EPL appears well positioned to deliver sustained growth over the coming years.
Principal Investments
As at 30 June 2026
|
Holding |
Market cap size |
Sector |
Value £’000 |
% of Portfolio |
|
Skipper |
S |
Industrials |
8,300 |
6.2% |
|
RBL Bank |
M |
Financials |
7,580 |
5.6% |
|
Federal Bank |
M |
Financials |
6,568 |
4.9% |
|
Multi Commodity Exchange |
M |
Financials |
6,031 |
4.5% |
|
IDFC Bank |
M |
Financials |
5,332 |
4.0% |
|
Dixon Technologies |
M |
Consumer Discretionary |
4,811 |
3.6% |
|
Neuland Laboratories |
S |
Health Care |
4,810 |
3.6% |
|
City Union Bank |
S |
Financials |
4,685 |
3.5% |
|
Kajaria Ceramics |
S |
Industrials |
4,478 |
3.3% |
|
CCL Products India |
S |
Consumer Staples |
4,351 |
3.2% |
|
Cartrade Tech Limited |
S |
Consumer Discretionary |
4,111 |
3.0% |
|
Essel Propack |
S |
Materials |
3,903 |
2.9% |
|
Affle India |
S |
Communication Services |
3,812 |
2.8% |
|
Aether Industries |
S |
Health Care |
3,715 |
2.8% |
|
Coforge |
M |
Information Technology |
3,643 |
2.7% |
|
Atlanta Electricals |
S |
Industrials |
3,617 |
2.7% |
|
Emami |
S |
Consumer Staples |
3,567 |
2.6% |
|
Sona BLW Precision Forgings |
M |
Consumer Discretionary |
3,481 |
2.6% |
|
Nuvama Wealth Management |
S |
Financials |
3,470 |
2.6% |
|
PSP Projects |
S |
Industrials |
3,228 |
2.4% |
|
Total top 20 portfolio investments |
|
93,493 |
69.5% | |
Investments may be held by the Company and its Mauritian subsidiary, ICG Q Limited.
|
|
|
|
|
Market capitalisation size definitions for the six months to 30 June 2026*: |
|
|
|
|
|
|
|
L: Large cap – companies with a market capitalisation above US$11.5bn |
|
|
|
|
|
|
|
M: Mid cap – companies with a market capitalisation between US$4bn and US$11.5bn |
|
|
|
|
|
|
|
S: Small cap – companies with a market capitalisation below US$4bn |
|
|
*based on the classifications adopted by the Association of Mutual Funds in India (AMFI), which is mandated by the Securities and Exchange Board of India (SEBI) to define large, mid, and small-cap companies.
Portfolio Statement
|
HOLDING |
Market cap |
Nominal |
Value |
% of |
|
LISTED SECURITIES |
|
|
|
|
|
Communication Services |
|
|
|
|
|
Affle India |
S |
336,000 |
3,812 |
2.8% |
|
|
|
|
3,812 |
2.8% |
|
Consumer Discretionary |
|
|
|
|
|
Dixon Technologies |
M |
50,500 |
4,811 |
3.6% |
|
Cartrade Tech Limited |
S |
191,000 |
4,111 |
3.0% |
|
Sona BLW Precision Forgings |
M |
702,714 |
3,481 |
2.6% |
|
Gokaldas Exports |
S |
353,678 |
2,468 |
1.8% |
|
VIP Industries |
S |
975,000 |
2,382 |
1.8% |
|
Welspun India |
S |
1,614,596 |
2,050 |
1.5% |
|
|
|
|
19,303 |
14.3% |
|
Consumer Staples |
|
|
|
|
|
CCL Products India |
S |
460,923 |
4,351 |
3.2% |
|
Emami |
S |
1,104,000 |
3,567 |
2.6% |
|
|
|
|
7,918 |
5.8% |
|
Financials |
|
|
|
|
|
RBL Bank |
M |
2,570,000 |
7,580 |
5.6% |
|
Federal Bank |
M |
2,490,000 |
6,568 |
4.9% |
|
Multi Commodity Exchange |
M |
266,000 |
6,031 |
4.5% |
|
IDFC Bank |
M |
8,394,000 |
5,332 |
4.0% |
|
City Union Bank |
S |
2,810,666 |
4,685 |
3.5% |
|
Nuvama Wealth Management |
S |
240,405 |
3,470 |
2.6% |
|
|
|
|
33,666 |
25.1% |
|
Health Care |
|
|
|
|
|
Neuland Laboratories |
S |
32,393 |
4,810 |
3.6% |
|
Aether Industries |
S |
342,000 |
3,715 |
2.8% |
|
GPT Healthcare |
S |
2,250,168 |
2,671 |
2.0% |
|
|
|
|
11,196 |
8.4% |
|
Industrials |
|
|
|
|
|
Skipper |
S |
1,950,000 |
8,300 |
6.2% |
|
Kajaria Ceramics |
S |
462,900 |
4,478 |
3.3% |
|
Atlanta Electricals |
S |
249,500 |
3,617 |
2.7% |
|
PSP Projects |
S |
403,574 |
3,228 |
2.4% |
|
Uniparts India |
S |
562,237 |
3,027 |
2.2% |
|
Triveni Turbine |
S |
479,531 |
2,643 |
2.0% |
|
Elecon Engineering |
S |
542,000 |
2,312 |
1.7% |
|
Titagarh Rail Systems |
S |
304,462 |
2,143 |
1.6% |
|
|
|
|
29,748 |
22.1% |
|
Information Technology |
|
|
|
|
|
Coforge |
M |
311,000 |
3,643 |
2.7% |
|
Persistent Systems |
M |
84,000 |
2,904 |
2.2% |
|
|
|
|
6,547 |
4.9% |
|
Materials |
|
|
|
|
|
Essel Propack |
S |
2,172,459 |
3,903 |
2.9% |
|
Ramkrishna Forgings |
S |
687,400 |
3,103 |
2.3% |
|
JK Lakshmi Cement |
S |
623,000 |
3,016 |
2.2% |
|
PI Industries |
M |
115,000 |
2,348 |
1.7% |
|
Sagar Cements |
S |
1,611,000 |
2,294 |
1.7% |
|
|
|
|
14,664 |
10.8% |
|
|
|
|
|
|
|
Total equity investments (including those held by ICG Q Limited) |
126,854 |
94.2% | ||
|
|
|
|
|
|
|
Cash less other net current liabilities (including ICG Q Limited) |
7,846 |
5.8% | ||
|
Total Net Assets (before deferred tax provision for Indian CGT) |
134,700 |
100.0% | ||
|
|
|
|
|
|
|
Deferred tax provision for Indian CGT (including ICG Q Limited) |
(8,032) |
| ||
|
Total Net Assets (after deferred tax provision for Indian CGT) |
126,668 |
| ||
|
|
|
|
|
|
|
Notes: |
|
|
|
|
|
L: Large cap – companies with a market capitalisation above US$11.5bn |
|
0.00% | ||
|
M: Mid cap – companies with a market capitalisation between US$4.0bn and US$11.5bn |
31.8% | |||
|
S: Small cap – companies with a market capitalisation below US$4.0bn |
|
62.4% | ||
|
|
|
|
|
94.2% |
Environmental, Social and Governance Statement
Environmental, Social and Governance ("ESG") Matters
The Board continues to monitor the integration of ESG considerations into the Company's investment process through regular engagement with the Investment Manager. The Investment Manager continues to apply its proprietary ESG assessment framework to portfolio companies and to engage with investee companies on ESG-related matters.
The Board is satisfied that the Company's approach to ESG matters remains appropriate and consistent with that described in the 2025 Annual Report and Financial Statements. There have been no material changes to the Company's ESG policies, objectives or reporting during the six-month period ended 30 June 2026. Further details of the Company's ESG framework and reporting can be found in the 2025 Annual Report.
Directors’ Information
TheDirectors who served during the period and up to the date of signing,allofwhomarenon-executive directors,areasfollows:
Elisabeth Scott (Chair)
Elisabeth was appointed to the Board as Chair on 18 December 2017. She has more than 40 years’ experience in the asset management industry, having started her career in Edinburgh in the 1980s, then moving to Hong Kong in 1992 where she remained until 2008, latterly in the role of Managing Director and Country Head of Schroder Investment Management (Hong Kong) Limited. She is a Non-Executive Director of BlackRock World Mining Trust plc, and Chair of JPMorgan Emerging Markets Dividend Income Trust plc and a former Chair of the Association of Investment Companies (the “AIC”). She is resident in the UK.
PatrickFirth
Patrick was appointed to the Board in September 2020. He qualified as a Chartered Accountant with KPMG Guernsey in 1991 and is also a member of the Chartered Institute for Securities and Investment. He has worked in the fund industry in Guernsey since joining Rothschild Asset Management C.I. Limited in 1992 before moving to become managing director at Butterfield Fund Services (Guernsey) Limited (subsequently Butterfield Fulcrum Group (Guernsey) Limited), a company providing third party fund administration services, where he worked from April 2002 until June 2009. Patrick is a former Chairman of the Guernsey International Business Association and of the Guernsey Investment Fund Association. He is a Non-Executive Director of CT UK Capital and Income Investment Trust plc., VH Global Energy Infrastructure plc and The Schiehallion Fund Limited. He is resident in the UK.
LynneDuquemin
Lynne was appointed to the Board in May 2021. She has over 36 years’ experience in financial markets, initially in London in the late 1980s before being seconded by Credit Suisse to Guernsey, Channel Islands in 1995. Since 2020 she has led the investment arm of a Single Family Office in Guernsey, as their Chief Investment Officer. Prior to which she worked for twelve years as an Investment Consultant for an Independent Investment Consultancy. She is a Fellow of the Chartered Institute for Securities and Investment and a Chartered Wealth Manager. She is also an ASIP qualified member of the CFA UK and a member of the CFA, 953214, as well as a Chartered Director and Fellow of the Institute of Directors. Lynne is a director of several private companies, including a global operating company and has prior experience as a non-executive director of a listed Frontier Equities Investment Company. She is based in Guernsey, Channel Islands.
NickTimberlake
Nick was appointed to the Board in July 2022. He has 36 years’ experience in the asset management industry, mostly as a Portfolio Manager, he was with HSBC Global Asset Management between 2005 and 2020, initially as Global Head of Emerging Markets Equities and then Head of Equities. Previously he was a Director of F&C Investment Management and has spent the last 29 years investing in global emerging markets equities. He is a non-executive director of Aberdeen Equity Income Trust and a partner in Panorama Property Investments LLP. Nick is a member of the CFA Institute and CFA Society of the UK. He is resident in the UK.
Directors’ Report
The Directors present their interim report and the unaudited condensed financial statements of the Company for the period from 1 January 2026 to 30 June 2026.
The Company
India Capital Growth Fund Limited (the “Company”) was registered in Guernsey on 11 November 2005 and is a closed-ended investment company with its shares admitted to trading on the main market of the London Stock Exchange. The Company’s objective is to provide long-term capital appreciation by investing in companies based in India. The Company’s registration number is 43916. At 30 June 2026, the Company has one wholly owned Mauritian subsidiary, ICG Q Limited (“ICG Q”). The Company has an unlimited life, although a Redemption Facility was put in place following the passing of a shareholders’ resolution at an Extraordinary General Meeting (“EGM”) on 12 June 2020. The most recent redemption date was 29 November 2025 when 16,967,020 net shares were redeemed under the Redemption Facility.However, this Redemption Facility has now been replaced with a five-year conditional Performance-Related Tender for up to 25% of the Company’s issued share capital, following the passing of a shareholders' resolution at an EGM on 25 March 2026.
Corporate structure
The Board of Directors continues to take steps to close and to liquidate its Mauritian subsidiary, ICG Q, believing that it no longer serves a beneficial purpose for the Company’s shareholders. However, this process may take some time given the restrictions imposed by the Indian regulators on transferring listed Indian equities from one entity to another without incurring considerable costs and risk which the Board does not believe is in the interest of shareholders. The Company’s custodian is actively engaging with the Indian regulator to help facilitate this. In the meantime, the Investment Manager has moved Indian Rupee (“INR”) cash balances held by the Company’s custodian from ICG Q to the Company and has committed that all future purchases for the investment portfolio will be made by the Company directly, unless it is in shareholders’ interests to do otherwise.
Details of the authorised and issued share capital, together with details of the movements in the Company’s issued share capital during the period are shown in Note 8. The Company has one class of ordinary shares which carry no right to fixed income. Each share carries the right to one vote at general meetings of the Company.
There are no specific restrictions on the size of a holding or on the transfer of shares, which are both governed by the general provisions of the Articles of Incorporation and prevailing legislation. The directors are not aware of any agreements between holders of the Company’s shares that may result in restrictions on the transfer of securities or on voting rights.
Investment policy
The Company’s investment objective is to provide long-term capital appreciation by investing in companies based in India. The investment policy permits the Company to make investments in a range of Indian equity and equity-linked securities and predominantly in listed mid and small cap Indian companies with a smaller proportion in unlisted Indian companies. Investment may also be made in large cap listed Indian companies and in companies incorporated outside India which have significant operations or markets in India. While the principal focus is on investment in listed equity securities or equity-linked securities, the Company has the flexibility to invest in bonds (including non-investment grade bonds), convertibles and other types of securities. The Company may, for the purposes of hedging and investing, use derivative instruments such as financial futures, options and warrants. The Company may, from time to time, use borrowings to provide short-term liquidity and, if the Directors deem it prudent, for longer term purposes. The Directors intend to restrict borrowings on a longer-term basis to a maximum amount equal to 25% of the net assets of the Company at the time of the drawdown. It is the Company’s current policy not to hedge the exposure to the Indian Rupee.
The portfolio concentration ranges between 30 and 40 stocks; however, to the extent the Company grows, the number of stocks held may increase over time. The Company is subject to the following investment limitations:
- No more than 10% of total assets of ICG Q and the Company (measured at the time of investment) may be invested in the securities of any one issuer; and
- No more than 10% of total assets of ICG Q and the Company (measured at the time of investment) may be invested in listed closed-ended funds.
The Board of Directors of the Company does not intend to use derivatives for investment purposes. The Directors confirm the investment policy of the Company has been complied with throughout the period from 1 January 2026 to 30 June 2026.
Investment Manager and AIF Manager
On 9 April 2025, the Board approved the novation of the Investment Management and AIFM Agreement, originally entered into with Ocean Dial Asset Management Limited ("ODAM") on 19 September 2017 to River Global Investors LLP and SVM Asset Management Limited (trading as RGI Fund Management) ("SVM") respectively, with no changes to the terms of the agreement. SVM formed part of River Global PLC (formerly AssetCo plc) ("River Global"), which acquired ODAM on 2 October 2023.
On 3August 2026, the Board agreed to novate the Investment Management and AIFM Agreement entered into with River Global Investors LLP and SVM on 9 April 2025 to Liontrust Investment Partners LLP and Liontrust Management Limited, respectively, with no change to its terms. Liontrust Investment Partners and Liontrust Management Limited are members of Liontrust Asset Management PLC, which acquired River Global Holdings, the investment management division of River Global PLC on 1July 2026. See note 16 for further details.
Results and dividends
The Company’s performance during the period is discussed in the Investment Manager’s review.
The results for the period are set out in the unaudited condensed statement of comprehensive income below.
The Board declared its first interim dividend under the Company's dividend policy of 1.9 pence per share. The dividend will be payable on 30 October 2026 to shareholders on the register as at 2 October 2026. The Board's intention remains to pay an annual dividend equivalent to approximately 2% of the prevailing net asset value per share, with the aim of increasing this over time, subject to market conditions and the Company's financial position. No interim dividend was paid for the period ended 30 June 2025. The annual dividend for the year will be paid split across two payments, comprising an interim dividend in October and a second interim dividend paid in April.
Directors
The names and a short biography of the current Directors of the Company are set out above. Elisabeth Scott, Patrick Firth, Lynne Duquemin and Nick Timberlake served throughout the period and to date.
Substantial interests
Shareholders who held an interest of 3% or more of the Ordinary Share Capital of the Company at 31 August 2026 are stated in the table below:
|
|
|
|
|
No. of Shares |
|
% Holding |
|
Hargreaves Lansdown |
12,535,270 |
|
19.42 | |||
|
Interactive Investor |
12,193,615 |
|
18.89 | |||
|
AJ Bell |
4,714,972 |
|
7.31 | |||
|
JM Finn |
3,035,416 |
|
4.70 | |||
|
Hedley |
2,734,608 |
|
4.25 | |||
|
Raymond James Investment Services |
2,177,823 |
|
3.37 | |||
*Note - % Holding is the percentage of voting rights and issued share capital.
All substantial interests disclosed are held in nominee accounts, and in the opinion of the Directors, the Company has no ultimate controlling party.
Share buybacks
Under the resolution passed at the most recent Annual General Meeting held on 11 June 2026, the Directors may purchase through the market up to 20% of the Company's issued ordinary share capital.
During the period ended 30 June 2026, the Company purchased 1,749,500 ordinary shares for a total consideration of £2,732,070. The shares had an aggregate nominal value of £17,495 and represented 2.6% of the Company's issued ordinary share capital. Following the period end and up to the date of the approval of this report, the Company purchased a further 1,397,000 ordinary shares for a total consideration of £2,428,969.
Directors’ interests
At 30 June 2026, Directors and their immediate families held the following declarable interests in the Company:
|
Ordinary Shares |
|
|
|
|
|
30 June 2026 |
30 June 2025 |
31 December 2025 |
|
Elisabeth Scott |
50,000 |
50,000 |
50,000 |
|
Patrick Firth |
25,000 |
25,000 |
25,000 |
|
Lynne Duquemin |
43,570 |
25,200 |
25,200 |
|
Nick Timberlake |
65,000 |
57,500 |
57,500 |
Ongoing charges
In accordance with the recommended methodology set out by the Association of Investment Companies (the “AIC”), the ongoing charges of the Company and its subsidiary for the period ended 30 June 2026 were 1.76% based on an average monthly assets under management (“AUM”) of £115,647,651 (30 June 2025: 1.55% based on an average AUM of £155,035,702 and 31 December 2025: 1.62% based on an average monthly AUM of £154,758,718).
Outlook
The investment philosophy of the Company is that in India optimal returns will be generated over time by investing in companies that are well placed to benefit from the structural growth potential of the Indian economy. Whilst uncertainties remain, the future outlook for the portfolio investee companies remains generally strong. This is reflected in the fact that the NAV of the Company has increased over the two months since the period end.
Sustainability and environmental, social and governance (“ESG”)
The ongoing development of internal ESG capabilities and reporting by the Manager continues and is supported by the Directors. The Company’s statement on Sustainability and ESG is provided on page 16, and the Company’s report on Sustainability and ESG can be found in the 2025 Annual Report.
Principal Risks and Uncertainties
The Principal Risks and Uncertainties outlined in the Risk Management section of the Strategic Report on pages 24 to 27 of the 2025 Annual Report remain unchanged for the period to date with the exception of Emerging Risks.
The Board confirms that they have carried out a robust assessment of the principal risks facing the Company, including those that would threaten its business model, future performance, solvency or liquidity.
The Board has drawn up a Control Environment and Risk Assessment Matrix (the “Matrix”), which identifies the key risks to the Company and considers the impact and likelihood of each significant risk identified. The Board reviews the Matrix at least quarterly to ensure, in particular, that any emerging risks are identified, assessed and documented at an early stage.
The Principal Risks fall into several broad categories, which are set out below:
Investment performance and financial risk
Significant market, foreign currency, credit and liquidity risks faced by the Company are set out in note 10 to the financial statements. The Company could be severely affected by a change in market conditions leading to a fall in share price and potentially a widening of the discount to NAV. These risks and their mitigation controls are reviewed at each quarterly Board meeting.
Performance Related Tender mechanism and associated risk
On 25 March 2026, shareholders approved the replacement of the Company's two year redemption facility with a five-year conditional Performance-Related Tender mechanism. Under this arrangement, the Board will be required to propose a tender offer for up to 25% of the Company's issued share capital (excluding treasury shares) if the Company's NAV Total Return per Share (before the impact of Indian Capital Gains Taxation) over the relevant five-year period is less than the return of the MSCI India SMID Cap Index. Should the tender be triggered and accepted by shareholders, the Company's net assets may reduce materially, which could increase the ongoing charges ratio, reduce market liquidity and diminish economies of scale. The Board believes that the five-year measurement period is more closely aligned to the long-term nature of the Company's investment strategy and provides the Investment Manager with an appropriate timeframe over which to deliver shareholder value.
Emerging risks
Risks that emerge unexpectedly, and in some cases quite quickly, can have an economic impact upon the Company. Significant geopolitical conflicts such as the Russia/Ukraine conflict, Middle East conflict and the introduction of trade tariffs can disrupt global supply chains, the Indian economy and listed companies. The Board assesses and monitors these risks as and when they develop so, if necessary, controls and procedures can be implemented to mitigate against their economic impact upon the Company. During the period, there were no changes to the emerging risks identified, and no new procedures were implemented.
Cybersecurity, data security breach and related criminal activity risk
The Company is exposed to the risk of criminal attacks on its data and systems held and managed by its service providers. Cybersecurity controls at all service providers are reviewed on a regular basis. Controls at the administrator are subject to an annual controls audit which is reviewed by the Audit and Risk Committee and any anomalies or breaches followed up.
Operations and systems risk
The Company is exposed to the risks arising from any failure of systems and controls in the operations of the Investment Manager, the Administrator, or the Company’s other service providers. Under normal circumstances members of the Audit and Risk Committee visit the Investment Manager annually to perform a due diligence review of its controls and the Board receives reports annually from the Administrator on their internal controls.
The Board recognises the requirements of Provision 34 of the AIC Code and continues to enhance its assessment of the effectiveness of the Company's material controls through oversight of, and assurance obtained from, its delegated service providers.
Environmental and Social (“E&S”) impact risk
The potential loss or harm directly or indirectly resulting from environmental and social factors that impact the Company, its investors and its service providers, and the consequential impact on the environment and society. E&S impact risk is a transverse risk that impacts our other risks: investment performance risk, currency and emerging market risk, operational non-financial risk, legal and regulatory risk and reputation risk. Our investment manager has developed a qualitative scoring model which measures climate and other environmental impacts and the reporting thereof by the Company’s investment portfolio companies. The Investment Manager has an advisory team on the ground in India who keep abreast of the latest political developments and economic forecasts and regularly advise the Board thereof. The Board considers the reports from the Investment Manager and determines whether the Company is detrimentally affected.
Accounting, legal and regulatory risk
The Company is at risk if it fails to comply with the laws and regulations applicable to a company with a premium listing on the Main Market of the London Stock Exchange and the Guernsey, Mauritian and Indian laws and regulations or if it fails to maintain accurate accounting records. The Investment Manager and Administrator are both regulated entities. The Board receives quarterly compliance reports which are reviewed and challenged where necessary. The Investment Manager and Administrator provide the Board with regular reports on changes in regulations and accounting requirements. Legal advice is taken where appropriate. Any breaches are addressed as soon as they are highlighted to the Board and appropriate action is taken to rectify.
Capital Management
At the Extraordinary General Meeting held on 12 June 2020, shareholders approved the introduction of a Redemption Facility, enabling shareholders to redeem part or all their shareholding at specified Redemption Points.
During the period since its introduction, the Company has successfully met redemption requests made under the facility and has actively managed its capital through share buybacks and the operation of the Redemption Facility.
Following shareholder approval at an Extraordinary General Meeting on 25 March 2026, the Redemption Facility was replaced with a five-year conditional Performance-Related Tender for up to 25% of the Company's issued share capital. The Board believes that this mechanism is better aligned with the Company's long-term investment strategy and investment horizon.
Going Concern
The Board has assessed the Company's ability to continue as a going concern for at least the next twelve months from the date of approval of these unaudited condensed financial statements, considering all available information about the future. In performing this assessment, the Board considered, among other matters:
- the liquidity of the investment portfolio held by both the Company and its subsidiary, ICG Q Limited (83.5% of the portfolio can be liquidated within five days);
- the performance of the investment portfolio;
- the size of the Company and its impact on the Company's ongoing charges (the Company's NAV exceeded £100 million throughout the period);
- the level of operating expenses covered by highly liquid investments held within the portfolio (operating expenses are covered more than 50 times by highly liquid investments);
- the time required to remit funds from India to Mauritius and Guernsey to settle ongoing expenses (investments can be liquidated and Sterling funds received in Guernsey within ten working days); and
- the Company's five-year conditional Performance-Related Tender, including the timing of any potential tender offer, the conditions attaching to the mechanism and the Company's ability to fund any future repurchase of shares through available liquidity and the orderly realisation of investments.
Based on this assessment, the Directors are satisfied that the Company has adequate resources to continue in operation for at least the next twelve months from the date of approval of these unaudited condensed financial statements. Accordingly, the unaudited condensed financial statements have been prepared on a going concern basis.
Approved by the Board of Directors and signed on behalf of the Board on 23 September 2026:
Lynne Duquemin Patrick Firth
Statement of Directors’ responsibilities in respect of the half yearly financial report
We confirm that to the best of our knowledge:
- the unaudited condensed financial statements have been prepared in accordance with UK-adopted IAS 34, Interim Financial Reporting;
- the Interim Directors’ Report includes a fair review of the information required by DTR 4.2.7R, being an indication of important events that have occurred during the first six months of the financial year and their impact on the unaudited condensed financial statements, together with a description of the principal risks and uncertainties for the remaining six months of the financial year; and
- the Interim Directors’ Report includes a fair review of the information required by DTR 4.2.8R, being related party transactions that have taken place during the first six months of the financial year and that have materially affected the financial position or performance of the Company during that period, together with any changes in the related party transactions described in the latest Annual Report that could do so.
Signed on behalf of the Board by:
Lynne DuqueminPatrick Firth
23 September 2026
Unaudited Condensed Financial Statements
Unaudited Condensed Statement of Comprehensive Income
|
|
|
|
|
(Unaudited) Six months to 30 June 2026 |
(Unaudited) Six months to 30 June 2025 |
(Audited) Year to 31 December 2025 |
|
|
|
|
| |||
|
|
|
|
| |||
|
|
Notes |
Revenue £’000 |
Capital £’000 |
Total |
Total |
Total |
|
| ||||||
|
|
|
|
|
|
|
|
|
Income |
|
|
|
|
|
|
|
Dividend income |
|
120 |
- |
120 |
146 |
497 |
|
Net gain/(loss) on financial assets at fair value through profit or loss |
5 |
- |
5,326 |
5,326 |
(16,183) |
(18,401) |
|
Management fee contribution from subsidiary |
11 |
319 |
- |
319 |
555 |
1,062 |
|
Total income |
|
439 |
5,326 |
5,765 |
(15,482) |
(16,842) |
|
|
|
|
|
|
|
|
|
Expenses |
|
|
|
|
|
|
|
Foreign exchange loss |
|
(4) |
- |
(4) |
(371) |
(778) |
|
Management fees |
11 |
(644) |
- |
(644) |
(887) |
(1,787) |
|
Operating expenses |
3 |
(367) |
- |
(367) |
(280) |
(646) |
|
Professional fees |
|
(22) |
- |
(22) |
- |
- |
|
Transaction costs |
|
- |
(15) |
(15) |
(21) |
(61) |
|
Total expenses |
|
(1,037) |
(15) |
(1,052) |
(1,559) |
(3,272) |
|
|
|
|
|
|
|
|
|
Profit/(loss) for the period/year before taxation |
|
(598) |
5,311 |
4,713 |
(17,041) |
(20,114) |
|
|
|
|
|
|
|
|
|
Taxation |
6 |
(22) |
(1,379) |
(1,401) |
286 |
457 |
|
Total comprehensive income/(loss) for the period/year after taxation |
|
(620) |
3,932 |
3,312 |
(16,755) |
(19,657) |
|
|
|
|
|
|
|
|
|
Basic and diluted earnings/(loss) per Ordinary Share (pence) |
4 |
|
|
4.99 |
(19.60) |
(23.23) |
The notes below form part of these unaudited condensed financial statements.
The total column of this statement represents the Company’s statement of comprehensive income, prepared in accordance with IFRS Accounting Standards as adopted by the UK. The supplementary revenue and capital columns are both prepared under guidance published by the Association of Investment Companies, as disclosed in the Basis of Preparation in note 1.
Investment management fees receivable from ICG Q Limited (the “Subsidiary” or “ICG Q”) are calculated based on ICGQ NAV.
In the prior period, transaction costs were presented within the revenue column; in the current period, and the most recent annual financial statements for the year ended 31 December 2025, they have been presented within the capital column to align with the AIC SORP guidance.
The profit after tax is the “total comprehensive income” as defined by IAS 1. There is no other comprehensive income as defined by IFRS Accounting Standards and all the items in the above statement derive from continuing operations.
Unaudited Condensed Statement of Financial Position
|
|
|
|
(Unaudited) |
|
(Unaudited) |
|
(Audited) |
|
|
|
|
30 June 2026 |
|
30 June 2025 |
|
31 December 2025 |
|
|
Notes |
|
£’000 |
|
£’000 |
|
£’000 |
|
|
|
|
|
|
|
|
|
|
Non-current assets |
|
|
|
|
|
|
|
|
Financial assets at fair value through profit or loss |
5 |
|
121,743 |
|
157,229 |
|
126,310 |
|
|
|
|
|
|
|
|
|
|
Current assets |
|
|
|
|
|
|
|
|
Cash and cash equivalents |
13 |
|
7,072 |
|
6,860 |
|
1,120 |
|
Trade and other receivables |
|
|
1,124 |
|
311 |
|
786 |
|
|
|
|
8,196 |
|
7,171 |
|
1,906 |
|
|
|
|
|
|
|
|
|
|
Current liability |
|
|
|
|
|
|
|
|
Trade and other payables |
|
|
(214) |
|
(269) |
|
(241) |
|
|
|
|
|
|
|
|
|
|
Net current assets |
|
|
7,982 |
|
6,902 |
|
1,665 |
|
|
|
|
|
|
|
|
|
|
Non-current liability |
|
|
|
|
|
|
|
|
Deferred taxation |
6 |
|
(3,057) |
|
(2,199) |
|
(1,887) |
|
|
|
|
|
|
|
|
|
|
Net assets |
|
|
126,668 |
|
161,932 |
|
126,088 |
|
|
|
|
|
|
|
|
|
|
Equity |
|
|
|
|
|
|
|
|
Share capital |
8 |
|
656 |
|
854 |
|
673 |
|
Reserves |
|
|
126,012 |
|
161,078 |
|
125,415 |
|
|
|
|
|
|
|
|
|
|
Total equity |
|
|
126,668 |
|
161,932 |
|
126,088 |
|
|
|
|
|
|
|
|
|
|
Number of Ordinary Shares in issue |
8 |
|
65,572,624 |
|
85,415,644 |
|
67,322,124 |
|
|
|
|
|
|
|
|
|
|
Net asset value per Ordinary Share (pence) |
|
193.17 |
|
189.58 |
|
187.29 | |
|
|
|
|
|
|
|
|
|
The unaudited condensed financial statements were approved and authorised for issue by the Board of Directors on 23 September 2026 and signed on its behalf by:
Lynne Duquemin Patrick Firth
The notes below form part of these unaudited condensed financial statements.
Unaudited Condensed Statement of Changes in Equity
For the six months to 30 June 2026
|
(Unaudited) |
Notes |
Share Capital £’000 |
Capital Reserve £’000 |
Revenue Reserve £’000 |
Other Distributable Reserve £’000 |
Total £’000 | |
|
|
|
|
|
|
|
|
|
|
Balance as at 1 January 2026 |
|
673 |
118,064 |
(10,524) |
17,875 |
126,088 | |
|
|
|
|
|
|
|
|
|
|
Share repurchase |
|
8 |
(17) |
- |
- |
(2,715) |
(2,732) |
|
|
|
|
|
|
|
|
|
|
Total comprehensive income for the period |
|
- |
3,947 |
- |
(635) |
3,312 | |
|
|
|
|
|
|
|
|
|
|
Balance as at 30 June 2026 |
|
656 |
122,011 |
(10,524) |
14,525 |
126,668 | |
For the six months to 30 June 2025
|
(Unaudited) |
Notes |
Share Capital £’000 |
Capital Reserve £’000 |
Revenue Reserve £’000 |
Other Distributable Reserve £’000 |
Total £’000 | |
|
|
|
|
|
|
|
|
|
|
Balance as at 1 January 2025 |
|
858 |
135,919 |
(10,524) |
53,104 |
179,357 | |
|
|
|
|
|
|
|
|
|
|
Share repurchase |
|
8 |
(4) |
- |
- |
(666) |
(670) |
|
|
|
|
|
|
|
|
|
|
Total comprehensive loss for the period |
|
- |
(15,872) |
- |
(883) |
(16,755) | |
|
|
|
|
|
|
|
|
|
|
Balance as at 30 June 2025 |
|
854 |
120,047 |
(10,524) |
51,555 |
161,932 | |
For the year ended 31 December 2025
|
(Audited) |
Notes |
Share Capital £’000 |
Capital Reserve £’000 |
Revenue Reserve £’000 |
Other Distributable Reserve £’000 |
Total £’000 | |||||
|
|
|
|
|
|
|
|
| ||||
|
Balance as at 1 January 2025 |
|
|
858 |
135,919 |
(10,524) |
53,104 |
179,357 | ||||
|
|
|
|
|
|
|
|
| ||||
|
Share repurchase |
|
8 |
(185) |
- |
- |
(33,427) |
(33,612) | ||||
|
|
|
|
|
|
|
|
| ||||
|
Total comprehensive loss for the year |
|
- |
(17,855) |
- |
(1,802) |
(19,657) | |||||
|
|
|
|
|
|
|
| |||||
|
Balance as at 31 December 2025 |
|
|
673 |
118,064 |
(10,524) |
17,875 |
126,088 | ||||
The notes below form part of these unaudited condensed financial statements.
Unaudited Condensed Statement of Cash Flows
|
|
|
|
(Unaudited) 30 June 2026 |
|
(Unaudited) 30 June 2025 |
|
(Audited) 31 December 2025 |
|
|
|
|
|
| |||
|
|
Note |
£’000 |
|
£’000 |
|
£’000 | |
|
|
|
|
|
|
|
|
|
|
Cash flows from operating activities |
|
|
|
|
|
|
|
|
Profit/(loss) before tax |
|
|
4,713 |
|
(17,041) |
|
(20,114) |
|
|
|
|
|
|
|
|
|
|
Adjustments for: |
|
|
|
|
|
|
|
|
Net (gain)/loss on financial assets at fair value through profit or loss |
|
|
(5,326) |
|
16,183 |
|
18,401 |
|
Foreign exchange loss |
|
|
4 |
|
371 |
|
778 |
|
Dividend income |
|
|
(120) |
|
(146) |
|
(497) |
|
(Increase)/decrease in trade and other receivables |
(338) |
|
1,026 |
|
550 | ||
|
Increase/(decrease) in trade and other payables |
|
|
(27) |
|
(8) |
|
(35) |
|
Cash (used in)/generated from operations before dividends and tax |
|
|
(1,094) |
|
385 |
|
(917) |
|
Dividend income |
|
|
120 |
|
146 |
|
497 |
|
Taxes paid |
|
|
(231) |
|
(25) |
|
(166) |
|
Net cash flows (used in)/generated from operating activities |
|
|
(1,205) |
|
506 |
|
(586) |
|
|
|
|
|
|
|
|
|
|
Cash flows from investing activities |
|
|
|
|
|
|
|
|
Acquisition of investments |
5 |
(2,603) |
|
(9,455) |
|
(15,567) | |
|
Disposal of investments |
5 |
12,496 |
|
7,343 |
|
42,156 | |
|
Net cash flows generated from/(used in) investing activities |
|
|
9,893 |
|
(2,112) |
|
26,589 |
|
|
|
|
|
|
|
|
|
|
Cash flows from financing activities |
|
|
|
|
|
|
|
|
Share buybacks |
|
|
(2,732) |
|
(670) |
|
(33,612) |
|
Net cash flows used in financing activities |
|
|
(2,732) |
|
(670) |
|
(33,612) |
|
|
|
|
|
|
|
|
|
|
Net increase/(decrease) in cash and cash equivalents during the period/year |
|
|
5,956 |
|
(2,276) |
|
(7,609) |
|
|
|
|
|
|
|
|
|
|
Cash and cash equivalents at the start of the period/year |
|
|
1,120 |
|
9,507 |
|
9,507 |
|
|
|
|
|
|
|
|
|
|
Foreign exchange loss |
|
|
(4) |
|
(371) |
|
(778) |
|
Cash and cash equivalents at the end of the period/year |
|
|
7,072 |
|
6,860 |
|
1,120 |
The presentation of dividend income has been reclassified from investing activities to operating activities as it forms part of the Company’s ordinary revenue-generating operations.
The notes below form part of these unaudited condensed financial statements.
Notes to the Unaudited Condensed Financial Statements
1. Material accounting policies
Basis of accounting
These unaudited condensed financial statements have been prepared in accordance with UK adopted IAS 34, “Interim Financial Reporting”, as required by DTR 4.2.4R, and applicable legal and regulatory requirements. The accounting policies and methods of computation applied in these condensed financial statements are consistent with those applied in the Annual Report and Financial Statements for the year ended 31 December 2025.
Basis of preparation
The unaudited condensed financial statements do not include all of the information required for a complete set of financial statements prepared in accordance with IFRS Accounting Standards as adopted by the UK and should be read in conjunction with the Company's Annual Report and Financial Statements for the year ended 31 December 2025, which were prepared in accordance with IFRS Accounting Standards as adopted by the UK.
Going Concern
The Board has assessed the Company's ability to continue as a going concern for at least the next twelve months from the date of approval of these unaudited condensed financial statements, considering all available information about the future. In performing this assessment, the Board considered, among other matters:
- the liquidity of the investment portfolio held by both the Company and its subsidiary, ICG Q Limited (83.5% of the portfolio can be liquidated within five days);
- the performance of the investment portfolio;
- the size of the Company and its impact on the Company's ongoing charges (the Company's NAV exceeded £100 million throughout the period);
- the level of operating expenses covered by highly liquid investments held within the portfolio (operating expenses are covered more than 50 times by highly liquid investments);
- the time required to remit funds from India to Mauritius and Guernsey to settle ongoing expenses (investments can be liquidated and Sterling funds received in Guernsey within ten working days); and
- the Company's five-year conditional Performance-Related Tender, including the timing of any potential tender offer, the conditions attaching to the mechanism and the Company's ability to fund any future repurchase of shares through available liquidity and the orderly realisation of investments.
Based on this assessment, the Directors are satisfied that the Company has adequate resources to continue in operation for at least the next twelve months from the date of approval of these unaudited condensed financial statements. Accordingly, the unaudited condensed financial statements have been prepared on a going concern basis.
New Accounting Standards interpretations and amendments adopted in the reporting period
There were no new accounting standards, interpretations and amendments adopted in the reporting period that had a material impact on the unaudited condensed financial statements of the Company.
New and amended accounting standards applicable to future reporting periods
The following relevant standards, which have not been applied in these unaudited condensed financial statements, were in issue at the reporting date but not yet effective:
- IFRS 7 (amended), “Financial Instruments: Disclosures” (effective for accounting periods commencing on or after 1 January 2026); and
- IFRS 9 (amended), “Financial Instruments” (effective for accounting periods commencing on or after 1 January 2026); and
- IFRS 18, “Presentation and Disclosures in Financial Statements” (effective for accounting periods commencing on or after 1 January 2027).
The amendments to IFRS 7 and IFRS 9 were published in May 2024 and relate to the classification and measurement of financial instruments.
Except for IFRS 18, the Directors do not anticipate that the adoption of these new and amended standards in future periods will have a material impact on the financial statements of the Company.
IFRS 18, “Presentation and Disclosure in Financial Statements”
IFRS 18 was issued in April 2024 and replaces IAS 1 “Presentation of Financial Statements”. The new standard introduces revised presentation requirements for the primary financial statements, including new categories and required subtotals in the statement of profit or loss, enhanced aggregation and disaggregation principles, and new disclosure requirements for management‑defined performance measures. The Company will apply IFRS 18 for annual reporting periods beginning on or after 1 January 2027. The Company does not plan to adopt the standard early. IFRS 18 is expected to result in changes to the presentation and disclosure of primary statements and related notes.
Determination of functional currency
Although the Company’s underlying investments are predominantly located in India, the Board has determined that Sterling (£) is the Company’s functional currency. This reflects the fact that the Company’s shares are denominated in Sterling, capital is raised in Sterling, and the majority of its operating expenses are incurred in Sterling. Sterling has therefore been adopted as both the functional and presentational currency of the unaudited condensed financial statements.
Investment management fees
Investment management fees are payable to the Investment Manager in accordance with the Investment Management Agreement (see Notes 11 and 12). Investment management fees are charged based on the assets of ICGF, including those held within its subsidiary ICG Q, and this amount is recognised as an expense in the revenue column of the statement of comprehensive income. ICG Q bears the proportion of the investment management fee that relates to the assets held within ICG Q, and this contribution towards the investment management fee is recognised as income in the revenue column of the statement of comprehensive income.
Impact of IFRS 10, “Consolidated Financial Statements”
The Board has concluded that the Company is an investment entity as it satisfies more than one of the typical characteristics of an investment entity as noted below:
- Obtaining funds from one or more investors for the purpose of providing those investors with investment management services - the Board of Directors of the Company has delegated this function to its investment manager, Liontrust Investment Partners LLP (formerly River Global Investors LLP);
Commits to its investors that its business purpose is to invest funds solely for returns from capital appreciation, investment income or both - funds are invested in ICG Q Limited for the sole purpose of achieving capital appreciation via further placements in Indian listed securities; and
- Measures and evaluates the performance of substantially all of its investments on a fair value basis - on a monthly basis, the Company’s investment in ICG Q Limited is revalued at the prevailing NAV at the corresponding valuation date.
IFRS 10 requires investment entities to fair value all subsidiaries that are themselves investment entities. As the subsidiary also meets the criteria of an investment entity, it has not been consolidated. Therefore, these unaudited condensed financial statements represent the standalone results of the Company.
2. Critical accounting judgements and key sources of estimation uncertainty
Directors make judgements, estimates and assumptions that affect the application of policies and the reported amounts of assets and liabilities, income and expenses. The estimates and associated assumptions are based on historical experience and various other factors that are believed to be reasonable under the circumstances, the results of which form the basis of making judgements about the carrying value of assets and liabilities that are not readily apparent from other sources. The Company makes estimates and assumptions concerning the future. The resulting accounting estimates will, by definition, seldom equate to the related actual results.
Critical accounting judgements
There are no critical accounting judgements that require disclosure under IAS 1, “Presentation of Financial Statements”.
Key sources of estimation uncertainty
The Company invests in listed securities, and the valuation of these investments does not require the use of significant estimates. The underlying investments held by ICG Q are also listed, and the remaining components of ICG Q’s net asset value comprise instruments that do not involve estimation techniques. Accordingly, the Company has no key sources of estimation uncertainty requiring disclosure under IAS 1. Details of the valuation methodologies applied to the Company’s investments are provided in Note 9.
3. Operating expenses
|
|
(Unaudited) |
|
(Unaudited) |
|
(Audited) |
|
|
Six months to |
|
Six months to |
|
Year to |
|
|
30 June 2026 |
|
30 June 2025 |
|
31 December 2025 |
|
|
£’000 |
|
£’000 |
|
£’000 |
|
|
|
|
|
|
|
|
Administration and secretarial fees |
32 |
|
45 |
|
93 |
|
Audit fees |
24 |
|
31 |
|
62 |
|
Broker fees |
38 |
|
17 |
|
36 |
|
Directors’ and officers’ insurance |
9 |
|
8 |
|
17 |
|
Directors’ fees |
78 |
|
66 |
|
135 |
|
Directors’ expenses |
5 |
|
2 |
|
6 |
|
Marketing expenses |
55 |
|
37 |
|
70 |
|
Professional fees |
31 |
|
30 |
|
62 |
|
Registrar fee |
32 |
|
4 |
|
24 |
|
Regulatory fees |
9 |
|
13 |
|
31 |
|
Other expenses |
54 |
|
27 |
|
110 |
|
|
367 |
|
280 |
|
646 |
4. Basic and diluted earnings/(loss) per share
Earnings/(loss) per Ordinary Share and the fully diluted earnings/(loss) per share are calculated on the profit for the period of £3,312,000 (30 June 2025: loss of £16,755,000) divided by the weighted average number of Ordinary Shares in issue of 66,374,936 (30 June 2025: 85,489,346) (excluding Treasury shares).
5. Financial assets at fair value through profit or loss (“FVTPL”)
Financial assets at FVTPL consists of investments in securities listed on Indian Stock Exchanges, namely the National Stock Exchange or the Bombay Stock Exchange, as well as investment in the wholly owned subsidiary, ICG Q Limited. A summary of movements is shown below:
|
|
(Unaudited) Six months to 30 June 2026 |
|
(Unaudited) Six months to 30 June 2025 |
|
(Audited) Year to 31 December 2025 |
|
|
|
| |||
|
|
|
| |||
|
|
£’000 |
|
£’000 |
|
£’000 |
|
|
|
|
|
|
|
|
Fair value at beginning of period/year |
126,310 |
|
171,300 |
|
171,300 |
|
Disposal of investments |
(12,496) |
|
(7,343) |
|
(42,156) |
|
Acquisition of investments |
2,603 |
|
9,455 |
|
15,567 |
|
Realised gain on disposal of investments |
8,197 |
|
3,457 |
|
26,214 |
|
Unrealised loss on revaluation |
(2,871) |
|
(19,640) |
|
(44,615) |
|
Fair value at the end of period/year |
121,743 |
|
157,229 |
|
126,310 |
The net realised and unrealised gain above totalling £5,326,000 (30 June 2025: loss of £16,183,000) on financial assets at FVTPL comprise the loss on the Company’s holding in ICG Q Limited to the extent of £448,000 (30 June 2025: £9,636,000) and gain of £5,774,000 (30 June 2025: loss of £6,547,000) arising from investments in securities listed on Indian stock markets. The movement arising from the Company’s holding in ICG Q Limited is driven by the following amounts within the financial statements of ICG Q Limited, as set out below.
|
|
(Unaudited) Six months to 30 June 2026 |
|
(Unaudited) Six months to 30 June 2025 |
|
(Audited) Year to 31 December 2025 |
|
|
|
| |||
|
|
|
| |||
|
|
£’000 |
|
£’000 |
|
£’000 |
|
|
|
|
|
|
|
|
Dividend income |
95 |
|
179 |
|
606 |
|
Unrealised loss on financial assets at FVTPL |
(6,673) |
|
(14,868) |
|
(31,229) |
|
Foreign exchange loss |
(1,045) |
|
(1,500) |
|
(5,335) |
|
Realised gain on disposal of investments |
7,877 |
|
6,360 |
|
26,608 |
|
Investment management fees |
(319) |
|
(555) |
|
(1,062) |
|
Other operating expenses |
(42) |
|
(53) |
|
(100) |
|
Withholding tax on dividend income |
(20) |
|
(37) |
|
(129) |
|
Deferred taxation for Indian CGT |
- |
|
1,326 |
|
- |
|
Taxation/tax refund |
(293) |
|
(461) |
|
626 |
|
Transaction costs |
(28) |
|
(27) |
|
(107) |
|
Fair value movement in the Company’s investment in ICG Q Limited |
(448) |
|
(9,636) |
|
(10,122) |
The equity investment represents ICG Q Limited, the Company’s wholly owned subsidiary. ICG Q Limited is incorporated and has its principal place of business in the Republic of Mauritius. The Company holds Participating Shares in ICG Q Limited, which confer voting rights to the Company, hence controlling interests.
6.Taxation
Guernsey
The Company is exempt from Guernsey income tax on non-Guernsey source income under The Income Tax (Exempt Bodies) (Guernsey) Ordinance, 1989 (as amended), and pays an annual exemption fee of £1,600 (2025: £1,600). Accordingly, no Guernsey taxation was payable during the period (30 June 2025: £Nil).
Indian capital gains tax
Capital gains arising on the disposal of Indian equity investments are subject to Indian capital gains tax. In accordance with IAS 12, the subsidiary recognises a deferred tax liability in respect of unrealised gains on Indian equity investments.
The deferred tax liability relating to Indian capital gains tax amounted to £3,057,000 at 30 June 2026 (30 June 2025: £2,199,000; 31 December 2025: £1,887,000).
Dividend withholding tax
Dividend income from Indian companies is subject to withholding tax at source. The withholding tax charge for the period was £22,000 for the Company (30 June 2025: £24,000).
Pillar Two top‑up tax
As at 30 June 2026, India had not enacted or substantively enacted Pillar Two legislation.
Guernsey implemented Pillar Two from 1 January 2025; however, the rules apply only to multinational groups with consolidated revenue above €750 million and therefore do not apply to the Company.
7.Segmental information
The Board has considered the provisions of IFRS 8 in relation to segmental reporting and concluded that the Company’s activities are from a single segment under the standard. From a geographical perspective, the Company’s activities are focused in a single area – India. The subsidiary, ICG Q Limited, focuses its investment activities in listed securities in India. Additional disclosures have been provided in the 2025 Annual Report as elaborated in the Directors’ Report therein.
8.Share capital
Authorised Share Capital
Unlimited number of Ordinary Shares of £0.01 each
|
Issued share capital |
|
Number of shares |
|
Share capital | |
|
|
|
|
|
|
£’000 |
|
At 30 June 2026 |
|
|
65,572,624 |
|
656 |
|
At 30 June 2025 |
|
|
85,415,644 |
|
854 |
|
At 31 December 2025 |
|
|
67,322,124 |
|
673 |
The Ordinary Shares of the Company carry the following rights:
- The holders of Ordinary Shares have the right to receive in proportion to their holdings all the revenue profits of the Company (including accumulated revenue reserves) attributable to the Ordinary Shares as a class available for distribution and determined to be distributed by way of interim and/or final dividend at such times as the Directors may determine.
- On a winding-up of the Company, after paying all the debts attributable to and satisfying all the liabilities of the Company, holders of the Ordinary Shares shall be entitled to receive by way of capital any surplus assets of the Company attributable to the Ordinary Shares as a class in proportion to their holdings.
- Subject to any special rights or restrictions for the time being attached to any class of shares, on a show of hands every member present in person has one vote. Upon a poll every member present in person or by proxy has one vote for each share held by them.
SharesboughtbacktoTreasury
A total of 1,749,500 ordinary shares were bought back during the period ended 30 June 2026 at an average price of £1.5616 per share. These shares were transferred from the Issued Share Capital Account to the Treasury Shares Account and were purchased at a discount to the NAV per share.
Other distributable reserves
Other distributable reserves includes all other gains and losses during the year except for the realised and unrealised gains and losses on the investments measured at FVTPL. Other distributable reserves also includes foreign exchange gains and losses made on ordinary transactions, dividend income and general expenses, as well as taxation.
9. Fair value of financial instruments
The following tables show financial instruments recognised at fair value, analysed between those whose fair value is based on:
- Quoted prices in active markets for identical assets or liabilities (Level 1);
- Those involving inputs other than quoted prices included in Level 1 that are observable for the asset or liability, either directly (as prices) or indirectly (derived from prices) (Level 2); and
- Those with inputs for the asset or liability that are not based on observable market data (unobservable inputs) (Level 3).
The analysis as at 30 June 2026 is as follows:
|
(Unaudited) |
Level 1 |
|
Level 2 |
|
Level 3 |
|
Total |
|
|
£’000 |
|
£’000 |
|
£’000 |
|
£’000 |
|
|
|
|
|
|
|
|
|
|
Listed securities |
69,335 |
|
- |
|
- |
|
69,335 |
|
Investment in subsidiary |
- |
|
52,408 |
|
- |
|
52,408 |
|
Total |
69,335 |
|
52,408 |
|
- |
|
121,743 |
The analysis as at 30 June 2025 is as follows:
|
(Unaudited) |
Level 1 |
|
Level 2 |
|
Level 3 |
|
Total |
|
|
£’000 |
|
£’000 |
|
£’000 |
|
£’000 |
|
|
|
|
|
|
|
|
|
|
Listed securities |
66,189 |
|
- |
|
- |
|
66,189 |
|
Investment in subsidiary |
- |
|
91,040 |
|
- |
|
91,040 |
|
Total |
66,189 |
|
91,040 |
|
- |
|
157,229 |
The analysis as at 31 December 2025 is as follows:
|
(Audited) |
Level 1 |
|
Level 2 |
|
Level 3 |
|
Total |
|
|
£’000 |
|
£’000 |
|
£’000 |
|
£’000 |
|
|
|
|
|
|
|
|
|
|
Listed securities |
64,324 |
|
- |
|
- |
|
64,324 |
|
Investment in subsidiary |
- |
|
61,986 |
|
- |
|
61,986 |
|
Total |
64,324 |
|
61,986 |
|
- |
|
126,310 |
The Company’s investment in ICG Q Limited, the Company’s wholly owned subsidiary, is priced based on the subsidiary’s NAV as calculated as at the reporting date. The Company has the ability to redeem its investment in ICG Q Limited at the NAV at the measurement date therefore this is categorised as level 2. The classification within the hierarchy does not necessarily correspond to the Investment Manager’s perceived risk of the investment, nor the level of the investments held within the subsidiary.
All the underlying investments of ICG Q Limited are categorised as level 1 at 30 June 2026 and 2025. The period-end fair value of those investments, together with cash held in ICG Q Limited, comprise all but an insignificant proportion of the NAV of the subsidiary.
There has been no movement between levels for the period ended 30 June 2026 (31 December 2025: no movement between levels). There were no changes in valuation techniques during the period ended 30 June 2026 (31 December 2025: no changes).
10. Financial risk management
The Company's financial risk management objectives and policies are consistent with those disclosed in the Company's Audited Annual Financial Statements for the year ended 31 December 2025. There have been no material changes to the Company's financial risk exposures during the period.
11. Material agreements
Investment Management Agreement –
Liontrust Investment Partners LLP(formerly River Global Investors LLP)
During the period, the investment management fee was equivalent to 1.25% per annum of the lower of the Company’s market capitalisation or aggregate value of its assets less current liabilities, calculated and payable monthly in arrears. The Investment Manager earned £644,000 in management fees during the six months ended 30 June 2026 (six months ended 30 June 2025: £887,000 and year ended 31 December 2025: £1,787,000) of which £57,000 was outstanding at 30 June 2026 (30 June 2025: £97,000 and 31 December 2025: £181,000).
Administration Agreement –
Apex Fund and Corporate Services (Guernsey) Limited
Under the terms of the Administration Agreement (valid prior to 1 October 2025), Apex Fund and Corporate Services (Guernsey) Limited was entitled to a minimum annual fee of US$41,000 or a fee of 5 basis points of the NAV of the Company, whichever is greater. The Administrator was also entitled to reimbursement of all out-of-pocket expenses recoverable by way of a fixed disbursement charge of US$50 per month excluding all international calls and courier.
Effective 1 October 2025, the Board agreed to an amended administration fee basis, subject to satisfactory performance by the Administrator under its Service Level Agreement approved on 9 December 2025, as set out below:
- A minimum annual fee of £45,000 or a fee of 5 basis points of the NAV of the Company; and
- An annual Financial Reporting Fee of £22,500 (charged at a rate of £15,000 per annum from 1 October 2024 to 31 March 2026 increasing to £22,500 per annum from 1 April 2026); and
- An annual Company Secretarial fee of £35,000 (charged at a rate of £21,250 per annum from 1 October 2024 to 31 March 2026, increasing to £35,000 per annum from 1 April 2026).
The Administrator earned £32,000 for administration and secretarial services during the period ended 30 June 2026 (six months ended 30 June 2025: £45,000 and year ended 31 December 2025: £93,000) of which £14,000 was outstanding at 30 June 2026 (30 June 2025: £33,000 and 31 December 2025: £23,000).
Apex Fund Services (Mauritius) Ltd, a subsidiary of Apex Group Ltd (the parent of the Administrator), acts as administrator to the Company’s subsidiary ICG Q. During the period ended 30 June 2026, the subsidiary’s administrator earned fees totalling £18,447 (30 June 2025: £18,042).
12. Related Party Transactions
The Directors are responsible for the determination of the investment policy and have overall responsibility for the Company’s activities and are therefore regarded as related parties.
Directors’ remuneration
Directors’ remuneration is set out in the Directors’ remuneration report on page 42 of the Annual Report and Audited Financial Statements.
Investment Management Agreement
Liontrust Investment Partners LLP (formerly River Global Investors LLP)acts as the Company’s Investment Manager under the terms of the Investment Management Agreement. Under this agreement, the Investment Manager has responsibility for the day‑to‑day discretionary management of the Company’s portfolio in accordance with the Company’s investment objective and policy, subject to the overall supervision of the Directors and the investment restrictions set out in the Investment Management Agreement. The Investment Manager is entitled to receive a management fee for these services, and details of the fees charged during the year and amounts outstanding at the reporting date are provided in Note 11.
Shares held by related parties
At 30 June 2026, Directors and their immediate families held the following declarable interests in the Company:
|
Ordinary Shares |
|
|
|
|
|
30 June 2026 |
30 June 2025 |
31 December 2025 |
|
Elisabeth Scott |
50,000 |
50,000 |
50,000 |
|
Patrick Firth |
25,000 |
25,000 |
25,000 |
|
Lynne Duquemin |
43,570 |
25,200 |
25,200 |
|
Nick Timberlake |
65,000 |
57,500 |
57,500 |
13. Cash and cash equivalents
Cash and cash equivalents are comprised of:
|
|
(Unaudited) |
|
(Unaudited) |
|
(Audited) |
|
|
Six months |
|
Six months |
|
Year |
|
|
to 30 June 2026 |
|
to 30 June 2025 |
|
to 31 December 2025 |
|
|
Total |
|
Total |
|
Total |
|
|
£’000 |
|
£’000 |
|
£’000 |
|
|
|
|
|
|
|
|
Cash at bank |
4,322 |
|
4,135 |
|
1,120 |
|
Short-term investment |
2,750 |
|
2,725 |
|
- |
|
|
7,072 |
|
6,860 |
|
1,120 |
14. Commitments
The Company had no outstanding contractual commitments in respect of investments at the reporting date (31 December 2025: no commitments).
15. Ultimate controlling party
In the opinion of the Directors of the Company, the Company has no ultimate controlling party.
16. Subsequent events
On 1 July 2026, Liontrust Asset Management PLC acquired River Global Holdings Ltd, the holding company that encompasses the asset management business of River Global PLC, including the Company's Investment Manager, River Global Investors LLP.
On 3 August 2026, RGI Fund Management Limited (AIF Manager) changed its name to Liontrust Management Limited and changed its registered address to 24/25 Charlotte Square, Edinburgh, United Kingdom, EH2 4ET.
On 3 August 2026, River Global Investors LLP (Investment Manager) changed its name to Liontrust Investment Partners LLP and changed its registered address from 30 Coleman Street, London, United Kingdom, EC2R 5AL to 2 Savoy Court, London, United Kingdom, WC2R 0EZ.
On 3August 2026, the Board agreed to novate the Investment Management and AIFM Agreement entered into with River Global Investors LLP and SVM on 9 April 2025 to Liontrust Investment Partners LLP and Liontrust Management Limited, respectively, with no change to its terms. Liontrust Investment Partners and Liontrust Management Limited are members of Liontrust Asset Management PLC, which acquired River Global Holdings, the investment management division of River Global PLC on 1July 2026. See note 16 for further details.
On 23 September 2026, the Board declared its first interim dividend under the Company's dividend policy of 1.9 pence per share. The dividend will be payable on 30 October 2026 to shareholders on the register as at 2 October 2026.
Following the period end and up to the date of the approval of this report, the Company purchased a further 1,397,000 ordinary shares for a total consideration of £2,428,969.
There are no other material events since the end of the reporting period which would require disclosure or adjustment to the unaudited condensed financial statements for the period ended 30 June 2026.
|
Directors Elisabeth Scott (Chair) Patrick Firth Lynne Duquemin Nick Timberlake
AIF Manager Liontrust Management Limited (formerly RGI Fund Management Limited) 24/25 Charlotte Square, Edinburgh, United Kingdom, EH2 4ET
Investment Manager Liontrust Investment Partners LLP (formerly River Global Investors LLP) 2 Savoy Court, London, United Kingdom, WC2R 0EZ
Fund Investment Adviser Gaurav Narain (Principal Adviser) Saltoro Investment Advisors Private Limited Overseas adviser to the Investment Manager
Custodian KotakMahindraBankLimited 3rd floor,27BKC, C-27GBlock, BandraKurlaComplex,BandraEast, Mumbai, India, 400051
Broker and Sponsor ShoreCapitalStockbrokersLimited Cassini House 57-58St.James’sStreet, London, United Kingdom, SW1A1LD |
Registered Office 1 Royal Plaza, Royal Avenue, St. Peter Port, Guernsey, GY1 2HL
Administrator and Secretary Apex Fund and Corporate Services (Guernsey) Limited 1 Royal Plaza, Royal Avenue, St. Peter Port, Guernsey, GY1 2HL
Registrar NevilleRegistrarsLimited NevilleHouse, SteelparkRoad, Halesowen, Birmingham, United Kingdom, B628HD
Independent Auditor Deloitte LLP Regency Court Glategny Esplanade, St Peter Port, Guernsey, GY1 3HW
|
On 3August 2026, the Board agreed to novate the Investment Management and AIFM Agreement entered into with River Global Investors LLP and SVM on 9 April 2025 to Liontrust Investment Partners LLP and Liontrust Management Limited, respectively, with no change to its terms. Liontrust Investment Partners and Liontrust Management Limited are members of Liontrust Asset Management PLC, which acquired River Global Holdings, the investment management division of River Global PLC on 1July 2026. See note 16 for further details.
On 19January 2026, SVM changed its name to RGI Fund Management Limited. On the same date the company’s registered address changed from 7 Castle Street, Edinburgh, United Kingdom, EH2 3AH to 19 Charlotte Square, Edinburgh, United Kingdom, EH2 4DF.
On 3 August 2026, RGI Fund Management Limited changed its name to Liontrust Management Limited and changed its registered address to 24/25 Charlotte Square, Edinburgh, United Kingdom, EH2 4ET.
On 1 July 2026, Liontrust Asset Management PLC acquired River Global Holdings Ltd, the holding company that encompasses the asset management business of River Global PLC, including the Company's Investment Manager, River Global Investors LLP.
On 3 August 2026, River Global Investors LLP changed its name to Liontrust Investment Partners LLP and changed its registered address from 30 Coleman Street, London, United Kingdom, EC2R 5AL to 2 Savoy Court, London, United Kingdom, WC2R 0EZ.
This information is provided by RNS, the news service of the London Stock Exchange. RNS is approved by the Financial Conduct Authority to act as a Primary Information Provider in the United Kingdom. Terms and conditions relating to the use and distribution of this information may apply. For further information, please contact rns@lseg.com or visit www.rns.com.
RNS may use your IP address to confirm compliance with the terms and conditions, to analyse how you engage with the information contained in this communication, and to share such analysis on an anonymised basis with others as part of our commercial services. For further information about how RNS and the London Stock Exchange use the personal data you provide us, please see our Privacy Policy.
ENDRNS may use your IP address to confirm compliance with the terms and conditions, to analyse how you engage with the information contained in this communication, and to share such analysis on an anonymised basis with others as part of our commercial services. For further information about how RNS and the London Stock Exchange use the personal data you provide us, please see our Privacy Policy.