
Half-year Financial Report

Octopus Renewables Infra Trust PLC
22 September 2026
22 September 2026
LEI: 213800B81BFJKWM2JV13
Octopus Renewables Infrastructure Trust plc
("ORIT" or the "Company")
Half-Year Results to 30 June 2026
Resilient underlying cash generation
575 GWh of clean electricity generated
Octopus Renewables Infrastructure Trust plc, the diversified renewables infrastructure company, announces its unaudited interim results for the period from 1 January 2026 to 30 June 2026.
|
As at 30 June 2026 (unaudited) |
As at 31 December 2025 (audited) |
|
|
NAV per Ordinary Share (p) |
86.2 |
93.8 |
|
Ordinary Share Price (p) |
65.9 |
61.1 |
|
Net asset value ("NAV") (£ million) |
455 |
495 |
|
Gross asset value ("GAV") (£ million) |
852 |
897 |
|
H1 2026 |
H1 2025 |
|
|
Dividends declared per Ordinary Share (p) |
3.11 |
3.08 |
|
Dividend Cover |
1.38x |
1.19x |
|
Dividend Yield (%) |
9.5 |
8.4 |
|
Generation (including compensation from curtailment) (GWh) |
614 |
654 |
|
Revenue (operational portfolio) (£m) |
67.2 |
68.7 |
|
Earnings before interest, taxes, depreciation and amortisation ("EBITDA") (operational portfolio) (£m) |
42.1 |
44.3 |
Financial highlights
· NAV total return of -5.0% (H1 2025: -0.2%)
· Share price total return of 13.7% (H1 2025: 12.9%)
· Dividend in-line with FY 2026 target of 6.23p; cover improved to 1.38x (H1 2025: 1.19x)
· Revenue well protected with 86% fixed over the next two years; 42% inflation linked for next ten
· Revenue and EBITDA both ahead of budget
· NAV reduction primarily reflects the onshore wind energy yield review (-£30.4m), alongside lower long-term power price forecasts and increased discount rates; all onshore wind assets now valued using operational data and the latest technical evidence
· Total debt reduced by £5.3m to £396.8m, while the gearing ratio increased to 46.6% of GAV (31 December 2025: 44.8%) due to the reduction in portfolio value
· Adjusted weighted average discount rate increased to 8.8% (31 December 2025: 8.2%)
Operational and strategic highlights
· Capital recycling programme, in accordance with the Company's ORIT 2030 strategy, is progressing:
o One new investment opportunity in the final stages of negotiation
o Several portfolio asset sale processes initiated
· Follow-on commitment of £5.7m made to BLC Energy, taking total commitment to £10.4m
· Total compensated generation of 614 GWh, broadly in line with budget (-0.9%)
o Solar 2.8% and offshore wind 5.4% ahead, partially offset by onshore wind at 6.0% below the revised budget
· 154k estimated equivalent tonnes of CO2 avoided in H1 2026 (H1 2025: 165k)
· 16,853 people benefited from social initiatives, up significantly from 4,034 in H1 2025
Post period end
· A further interim dividend of 1.56p per share was paid on 1 September 2026, in respect of Q2 2026
Chris Gaydon and David Bird, co-fund managers of ORIT, commented: "ORIT's portfolio delivered resilient cash performance during the first half, with revenue and EBITDA ahead of budget and dividend cover increasing to 1.38x after scheduled debt amortisation.
"The reduction in NAV was disappointing but updating our onshore wind yield assumptions to reflect the assets' longer operating histories was necessary and provides a more robust valuation basis going forward. Solar and offshore wind both performed ahead of budget.
"We also advanced several asset-sale processes and committed a further £5.7 million to our UK solar development pipeline with BLC Energy. Our focus now is on progressing transactions, reducing gearing towards our medium-term anchor of 40% and investing only in the opportunities we have identified where returns justify the risk."
Phil Austin, Chair of ORIT, commented: "The first half of 2026 was challenging for ORIT, with NAV affected by the revised onshore wind yield assumptions, lower power-price forecasts and higher discount rates. Despite this, the underlying portfolio continued to generate strong, predictable cash flows.
"We remain on track to deliver our increased FY 2026 dividend target, with dividends fully covered by operational cash flows during the period. Shareholders also saw a rising share price and a narrowing discount to NAV, although the discount remains a key focus for the Board.
"We remain confident in the strength and diversification of the portfolio. With 86% of near-term revenues fixed or contracted, it continues to provide strong visibility and resilience, while recent M&A activity provides further evidence of the value within renewable infrastructure. Our focus remains on disciplined execution of ORIT 2030: completing asset sales, reducing gearing and selectively pursuing investments that deliver value for shareholders."
Interim Report and Accounts
To view the Company's Interim Report and Accounts please visit ORIT's website here:
https://www.octopusrenewablesinfrastructure.com/. Page number references in this announcement refer to pages in this report. The Interim Report and Accounts will also shortly be available on the National Storage Mechanism, which is situated at:
https://data.fca.org.uk/#/nsm/nationalstoragemechanism.
Results Presentations Today
There will be a virtual presentation for sell-side analysts today at 11:00am BST. Please contact Montfort Communications at orit@montfort.london to register.
The Company's management team will also provide a live presentation via the Investor Meet Company platform, today at 13:00 BST. The presentation is open to all existing and potential shareholders. Investors can sign up to Investor Meet Company for free here:
https://www.investormeetcompany.com/octopus-renewables-infrastructure-trust-plc/register-investor
A new investor presentation relating to the interim results will shortly be published on ORIT's website: https://www.octopusrenewablesinfrastructure.com/.
---
For further information please contact:
|
Montfort Communications (Public Relations) Imogen Saunders Octopus Energy Generation (Investment Manager) Chris Gaydon, David Bird Charlotte Edgar (Investor Relations) |
+44 (0)7826 547304 orit@octopusenergygeneration.com |
|
Peel Hunt (Broker) Luke Simpson, Tom Yeadon, Huw Jeremy (Investment Banking) Alex Howe, Chris Bunstead, Ed Welsby, Richard Harris (Sales) |
020 7418 8900 |
|
Apex Listed Companies Services (UK) Limited (Company Secretary) |
020 3327 9720 |
Notes to editors
About Octopus Renewables Infrastructure Trust
Octopus Renewables Infrastructure Trust ("ORIT") is a London-listed closed-ended investment company incorporated in England and Wales focused on providing investors with an attractive and sustainable level of income returns, with an element of capital growth, by investing in a diversified portfolio of renewable energy assets in Europe and Australia. As an impact fund, ORIT is helping accelerate the transition to net zero by investing in green energy, whilst also contributing to a broader set of UN Sustainable Development Goals through its impact initiatives. ORIT's investment manager is Octopus Energy Generation.
Further details can be found at: www.octopusrenewablesinfrastructure.com.
About Octopus Energy Generation
Octopus Energy Generation is driving the renewable energy agenda by building green power for the future. Its specialist renewable energy fund management team invests in renewable energy assets and broader projects helping the energy transition, across operational, construction and development stages. The team was set up in 2010 based on the belief that investors can play a vital role in accelerating the shift to a future powered by renewable energy. It has a 15-year track record with approximately £8.8 billion of assets under management (as at 30 June 2026) across 20 countries and with a total c.5.4 GW capacity under management. Octopus Energy Generation is the trading name of Octopus Renewables Limited.
Further details can be found at: www.octopusenergygeneration.com.
Page number references in this announcement refer to pages in the Company's simultaneously published Interim Report and Accounts.
Chair's Statement
Introduction
Dear Shareholder,
On behalf of the Board, I am pleased to present the Interim Report for Octopus Renewables Infrastructure Trust plc ("ORIT" or the "Company") for the six months ended 30 June 2026.
The first half of 2026 remained challenging for ORIT and for the listed renewable infrastructure sector more broadly. Persistent sector discounts, pressure on power price forecasts, subdued transaction volumes in the private markets and a changing policy backdrop continued to weigh on valuations and investor sentiment.
Despite the challenging backdrop, the underlying portfolio continued to generate strong and predictable cash flows. The Company declared dividends of 3.11 pence per Ordinary Share in respect of the period, in line with the FY 2026 dividend target of 6.23 pence per Ordinary Share. Based on this target, the shares offered a dividend yield of 9.5% at 30 June 2026. The Company remains on track to deliver its increased dividend target for FY 2026, with dividends fully covered by operational cash flows during the period. ORIT also continues to deliver tangible environmental benefits through the generation of renewable electricity across its diversified portfolio.
However, the Company reported a negative NAV total return over the six months to 30 June 2026, principally reflecting the impact of lower long-term power price forecasts, increased discount rates and, notably, the Q2 review of energy yield assessments ("EYAs") across the onshore wind portfolio as those assets accumulated a sufficient operational track record.
The first half of 2026 required the Board and Investment Manager to exercise careful judgement while continuing to oversee the delivery of ORIT 2030. While the strategy is designed to be implemented over several years, we recognise that shareholders want to see greater evidence of progress. We are very focused on advancing some of the opportunities under consideration into completed transactions and tangible outcomes.
While acutely aware of the challenges facing the listed renewable energy sector, we remain confident in the quality and strength of the portfolio to deliver on the Company's strategic priorities and generate long-term value for shareholders.
Board priorities in a challenging market
The external environment has remained challenging. Long‑term power price forecasts were reduced across several of the Company's markets, while sustained changes in market conditions and evolving transaction evidence warranted increases to discount rates for our European assets. The UK Government's decision not to extend Carbon Price Support beyond the current legislative period also had a modest negative impact on NAV. Alongside this, ORIT's shares traded at an average discount of 36.9% during the period, a level that remains a source of considerable frustration for the Board.
Against this backdrop, the Board has concentrated its efforts on the areas within its control. Throughout the period our priorities were to maintain rigorous oversight of valuation and risk, preserve balance-sheet flexibility and continue to challenge and support the Investment Manager in executing the ORIT 2030 plan. Maintaining a progressive dividend that is fully covered by operational cash flows also remained central to the Board's approach.
More broadly, persistent discounts and changing investor sentiment have accelerated structural change across the listed renewables sector. Several investment companies in our sector have entered wind-down, announced strategic transactions or been acquired, as boards have considered the appropriate response for their investment strategy in these market conditions. For ORIT, we remain committed to delivering an attractive total return to shareholders, including through asset sales as well as selective investment in development and construction-stage assets, where taking and managing earlier-stage risk offers the potential for enhanced returns. At the same time, the changing shape of the peer group is a clear reminder that listed renewable infrastructure companies must continue to demonstrate the value of their strategy and structure to shareholders.
The Board continues to monitor opportunities to increase the scale and investability of the Company, including through selective corporate transactions where these are in the interests of shareholders. During the period, we actively considered several opportunities. However, the wide discounts at which companies across the sector continue to trade can make transactions more challenging. We continue to believe that greater scale has the potential to enhance the Company's long-term competitiveness, but only where it is achieved on terms that create value for our shareholders.
The Board remains mindful of this evolving landscape. While each company must determine the course of action that best serves its own shareholders, our approach remains to deliver ORIT 2030 and demonstrate that disciplined execution of our strategy is the best route to creating long-term shareholder value.
That confidence is underpinned by the Company's differentiated portfolio, active management approach and clear strategic priorities, which together provide a compelling platform from which to deliver sustainable income and capital growth over the medium to long term.
During the period, a comprehensive review of the long-term energy yield assumptions across ORIT's onshore wind portfolio was completed. As the assets have matured and established sufficient operating histories, the Board and the Investment Manager, as planned, have replaced the remaining pre-construction forecasts with assumptions based on actual operational data and updated technical evidence. The resulting reduction in NAV was disappointing, but this update provides a robust valuation basis for the portfolio going forward.
ORIT's mature solar and offshore wind assets are already valued using assumptions informed by their operational performance. No updates to energy yield assumptions have been made for the more recently commissioned solar assets, as these continue to perform broadly in line with or ahead of their original engineering forecasts. The Board and the Investment Manager will continue to review long‑term operating assumptions across the portfolio as assets mature and additional operational evidence becomes available.
Financial performance and dividends
NAV per Ordinary Share fell from 93.8 pence as at 31 December 2025 to 86.2 pence as at 30 June 2026, representing an H1 2026 NAV total return of -5%. While the first quarter delivered a positive NAV total return, this was more than offset by the valuation impacts recognised during the second quarter, as outlined earlier.
These negative movements were partially offset by supportive macroeconomic assumptions, the extension of assumed operating lives for selected assets and the return generated by the portfolio over the period.
While the decline in NAV is disappointing, it is important to distinguish these valuation movements from the portfolio's underlying cash generation. Approximately 86% of forecast revenues for the two years to 30 June 2028 are fixed through government support schemes and power purchase agreements, providing significant near-term revenue visibility. Locking in prices under long-term contracts provides significant downside risk protection, albeit it means that the portfolio has not benefitted as much as it might have from the current price volatility driven by the geopolitical environment.
In line with the Company's progressive dividend policy, the Board is targeting a dividend of 6.23 pence per Ordinary Share for FY 2026, a 1% increase on FY 2025. At the half-year, the Company remains on track to meet this target. The dividend was fully covered by operational cash flows during the period, with dividend cover of 1.38x net of all scheduled debt amortisation.
Including dividends, shareholders experienced a positive share price total return of 13.7% over the six months to 30 June 2026, with the share price increasing 7.9% during the period. On a period-end reporting basis, the Company's discount to NAV narrowed from 34.9% as at 31 December 2025 to 23.5% as at 30 June 2026.
Gearing increased to 46.6% of GAV as at 30 June 2026, primarily as a consequence of the reduction in portfolio value, partially offset by a modest decrease in total debt. The Board remains committed to prudent balance-sheet management and continues to view approximately 40% of GAV as an appropriate medium-term anchor, while recognising that the absolute level will naturally fluctuate as market cycles change and the Company progresses with its strategic initiatives including assets sales and new investments.
Progress against ORIT 2030
ORIT 2030 sets out a five-year plan to grow NAV, build a larger and more investable Company, deliver attractive risk-adjusted total returns and increase ORIT's positive impact for its investors, the environment and society. Progress continues across each of these strategic priorities, although the pace of execution has been slower than originally anticipated.
Renewable infrastructure transactions are inherently complex, often involving multiple counterparties, financing arrangements and regulatory approvals. The Board remains confident in the opportunities under consideration but will not compromise value or transaction quality simply to accelerate the timetable.
During the period, ORIT made a follow-on investment into developer BLC Energy to advance projects towards ready-to-build status (read more about this on page 15). These investments are intended to preserve ORIT's access to higher-return opportunities while maintaining a disciplined approach to incremental capital deployment.
Capital recycling remains central to the ORIT 2030 strategy. Selective disposals are expected to support deleveraging and create capacity for reinvestment into higher-growth opportunities, particularly construction-stage assets. The Board continues to monitor progress closely and will update shareholders as transactions reach a stage at which they can appropriately be announced.
Portfolio resilience
The Board's continued confidence in ORIT is underpinned by the quality and diversification of the portfolio. ORIT provides exposure to a broad mix of renewable technologies and geographies, reducing reliance on any single market, asset or revenue source.
The solar and offshore wind portfolios performed broadly in line with, or ahead of, expectations during the period. Across the portfolio, the Investment Manager remains focused on improving operational availability, resolving asset-level issues at speed and protecting revenues through active contract and curtailment management.
Our Value Enhancement Programme provides a structured framework for identifying opportunities to improve returns and extend asset lives through initiatives such as repowering, hybridisation, co-location and targeted upgrades. An update on this initiative can be found on page 28. While the benefits of these initiatives will build over time, they are an important part of the Company's approach to active ownership and long-term value creation.
ORIT's contracted revenue base, diversified portfolio and active asset management provide resilience through periods of market and operational volatility, supporting both the Company's progressive dividend policy and its long-term investment objectives.
Impact and ESG
ORIT continues to deliver positive environmental and social outcomes alongside financial returns. During the period, the Company was once again awarded the London Stock Exchange's Green Economy Mark, a distinction it has held since IPO and which recognises companies and funds deriving at least 50% of revenues from products and services contributing to the global green economy. Further details of ORIT's environmental and social performance are set out on page 39 to 43 of this report.
Board and governance
The Company held its Annual General Meeting ("AGM") in June 2026, at which all resolutions were passed with an average of 99.2% of votes cast in favour. The Board remains grateful to shareholders for their continued support.
As previously announced, James Cameron stepped down from the Board at the June AGM. The Board does not intend to appoint a replacement, reflecting its continued focus on maintaining an appropriately sized Board and exercising cost discipline. Board composition, succession planning and skills coverage remain under regular review.
Strong and proportionate governance remains central to ORIT's ability to execute its strategy effectively. The Board continues to devote significant time to capital allocation, valuation, risk management and oversight of the Investment Manager, maintaining constructive challenge and acting in the long-term interests of shareholders.
Looking ahead
The Board's priorities for the second half are clear: maintaining full dividend cover, preserving balance-sheet flexibility, progressing asset sales and converting the opportunities under consideration into completed, value-accretive transactions. We recognise that shareholders want to see evidence of delivery against ORIT 2030, and this remains the principal focus of the Board and Investment Manager.
The wider market environment is likely to remain uncertain, but the long-term need for renewable generation, energy security and system flexibility remains compelling. ORIT's diversified portfolio, contracted revenue base and access to the specialist capabilities of Octopus Energy Generation position the Company well to navigate this environment and continue to pursue long-term value creation for shareholders.
On behalf of the Board, I would like to thank shareholders for their continued support, and the Investment Manager and its teams for their work during the period.
Philip Austin MBE
Chair, Octopus Renewables Infrastructure Trust plc
22 September 2026
Investment Manager's Report
Investment Manager Commentary
Chris Gaydon
Investment Director
David Bird
Investment Director
ORIT's objectives balance delivering a progressive, fully covered dividend while also building long-term value. Achieving both requires reliable cash generation, disciplined investment and careful debt management.
During H1 2026, the portfolio's cash performance was resilient: revenue and EBITDA were ahead of budget, and dividend cover increased to 1.38x after scheduled debt amortisation. Share price total return was also positive at 13.7%.
Against that, ORIT recorded a NAV total return of -5%. The principal driver was the revision of onshore wind yield assumptions in the second quarter in light of the significantly greater operational history now available. Further details can be found later in this commentary and in the Portfolio Valuation section on page 33. This was alongside increases in discount rates and lower long-term power-price forecasts. Progress on capital recycling and new investment under the ORIT 2030 strategy has been slower than we expected.
We do not want to blur the distinction between these outcomes. The portfolio generated cash ahead of budget, but the valuation result was disappointing. Our task now is to convert that operational resilience into shareholder value through the execution of planned transactions, a reduction in gearing and investment only where the expected return justifies the risk.
Market backdrop
Three developments have affected renewable infrastructure valuations since December 2025.
First, interest-rate expectations have remained elevated. Geopolitical tensions, including the ongoing conflict in Iran, have added to concerns about inflation and risk premia, contributing to a higher cost-of-capital environment.
Second, independent advisers have reduced medium- to long-term wholesale power-price forecasts in the UK and Ireland. This principally reflects expectations of renewable deployment and lower long-term gas prices, together with the UK Government's decision not to extend Carbon Price Support beyond the current legislative period.
Third, asset-level transaction evidence in deals across Europe has supported higher discount rates for relevant assets. Buyers remain active, but they are more selective and transactions are generally taking longer to complete. This evidence relates to specific asset valuations and is distinct from the corporate transactions taking place across the listed sector.
Against these valuation pressures, the longer-term demand outlook remains positive. The International Energy Agency expects EU electricity demand growth to accelerate to an average of 2.3% a year between 2026 and 2030, driven by data centres, electrification and a gradual recovery in industrial use. This would add approximately 300 TWh of additional consumption over this timeframe1.
1 International Energy Agency, Electricity 2026, "Demand", 6 February 2026. Available at: https://www.iea.org/reports/electricity-2026/demand.
Renewables supplied 47.3% of EU electricity generation in 20252. Meeting rising demand while continuing to decarbonise the power system will require substantial further investment in renewable generation, grids and flexibility. Geopolitical tensions have also reinforced the strategic importance of domestically generated renewable electricity and energy security.
2 Eurostat, "47% of EU electricity came from renewables in 2025", 19 March 2026. Available at: https://ec.europa.eu/eurostat/web/products-eurostat-news/w/ddn-20260319-2.
Listed renewable infrastructure companies nevertheless continue to trade at discounts substantially wider than the valuations seen in the underlying asset and corporate markets. Drax's acquisition of Bluefield Solar Income Fund ("BSIF"), announced in June 2026, illustrates the point. The offer represented a discount of approximately 9% to BSIF's NAV, compared with the approximately 29% discount at which its shares were trading immediately before the offer.
One transaction does not establish a market valuation. It does, however, provide further evidence that the discounts applied by listed markets are not necessarily replicated when the underlying assets are valued in corporate transactions.
Valuation and portfolio performance
During the period, we completed a review of long-term energy-yield assumptions across ORIT's onshore wind portfolio. The assets now have materially longer operating histories than were available when they were acquired or constructed. This allowed us to reassess their long-term generation expectations using actual performance data alongside updated technical and weather analysis.
The review concluded that the previous assumptions were no longer the best estimate of expected long-term generation. Updating these reduced the Q2 2026 NAV by 6%, or £30.4 million.
The resulting reduction in NAV is disappointing. However, once sufficient operational evidence was available, we agreed with the Board to undertake the review promptly. Ensuring valuation assumptions reflect the latest available evidence is a key part of the Company's robust and independent methodology. All of ORIT's onshore wind assets are now valued using their operating histories and the latest technical evidence, rather than relying on pre-construction forecasts.
We will keep these assumptions under review as the operating track record develops, including any emerging evidence on the potential effects of climate change on long-term wind resource and how this may vary geographically. The same evidence will inform future investment decisions, including the returns required for different technologies, resources and markets.
Operational performance during H1 2026 remained resilient. Total generation was broadly on budget. Solar generation was 3% ahead of budget and offshore wind was 5% ahead, offset by onshore wind generation that was 6% below the updated budget.
The onshore wind deficit was concentrated at two assets reflecting a combination of weaker wind resource and isolated operational issues. Performance across the remainder of the onshore wind portfolio was broadly in line with the updated energy yield assumptions.
Put simply, even as updated assumptions reduced the estimate of the portfolio's long-term value, the underlying assets generated cash ahead of our expectations during H1 2026.
Performance also benefited from targeted asset-management initiatives. At Leeskow (onshore wind), proactive management secured compensation for an additional 1.2 GWh of market curtailment in H1 2026 - a 95% improvement on the previous approach. At Breach solar farm, we secured lower network tariffs for auxiliary electricity, effective retrospectively from January 2026. This is expected to reduce import electricity costs by approximately 16% in FY 2026. We are also assessing further opportunities across the portfolio, including aerodynamic upgrades, frequency reserve services and power uprates. Revenue was £67.2 million (3% ahead of budget) and EBITDA was £42.1 million (6% ahead of budget), even accounting for the partial sales/sales of Breach and Crossdykes at the end of 2025. This was despite slightly lower overall generation and was driven by solar and offshore wind and the benefit of contracted revenues.
Dividend cover increased to 1.38x after scheduled debt amortisation, compared with 1.19x in the equivalent prior period.
Capital allocation and ORIT 2030
Our approach to capital allocation is based on achieving appropriate risk-adjusted returns, not deployment volume.
Construction-stage investments and development platforms can offer returns above those available from comparable operating assets, provided that construction, financing and delivery risks are managed successfully. This construction premium is the additional return available for taking and managing construction risk. Our investments in developer platforms offer a further strategic advantage by providing proprietary access to future construction-ready projects. In June we made a follow-on commitment of £5.7 million into our UK solar pipeline developed with BLC Energy (taking the total commitment to £10.4 million), and we expect this platform to start to deliver construction-ready assets in 2027. We will also consider recycling operating assets where the pricing and cash profile are attractive and support ORIT's progressive, fully covered dividend.
During H1 2026, we screened numerous potential investments across relevant markets. Opportunities representing approximately 182 MW progressed to detailed due diligence, but we ultimately decided not to invest. The principal reasons were mismatched pricing expectations with the sellers, and/or unacceptable balance of risk and return. Turning down these investments contributed to the slower-than-expected pace of delivery but proceeding on inadequate terms would have been a worse outcome for shareholders.
The hurdle for new investment is particularly high while ORIT's shares trade at a material discount and gearing is above its medium-term desired anchor point of 40%. Any new investment must be assessed against available alternatives, including reducing debt, investing in the existing portfolio and share buybacks, where appropriate and permitted.
We have live asset investment opportunities, including one that is in the final stages of negotiation. Timelines have extended as a result of on-the-ground construction challenges for the project at hand, and we will ensure that the expected return will compensate the project risk, as we would for any investment.
Following the successful sale of stakes in the Crossdykes wind farm and Breach solar farm to Tokyo Century late in 2025, we have initiated the next round of asset sales, with a number of processes underway. Demand for good-quality renewable infrastructure assets remains evident, but buyers are applying a high level of scrutiny to valuations, financing assumptions and operating performance. Financing and regulatory requirements are also lengthening transaction processes. We expect the next asset sales to complete late in 2026 or early in 2027.
We understand that ORIT 2030 will ultimately be judged on completed transactions and tangible outcomes, rather than the size of the opportunity pipeline. Progress has been slower than we originally expected, and improving the pace of execution remains a priority.
Balance-sheet management
Total debt reduced by £5.3 million during H1 2026. This included a more than £20 million reduction in long-term debt at project level, partly offset by an increase in RCF drawings.
Despite the reduction in debt, the gearing ratio increased slightly to 47% because the portfolio's GAV declined. Approximately 40% of GAV remains our medium-term gearing anchor. Gearing will move around that level as valuations change and capital is invested and recycled, but the present position is above where we intend it to be over the medium term.
We intend to reduce gearing towards the 40% anchor through repayments funded by the proceeds of asset sales, alongside the natural reduction which comes from the amortisation of long-term asset-level debt. We are actively exploring refinancing options to ensure the Company's gearing best supports the delivery of the ORIT 2030 priorities.
Near-term focus for H2 2026
Operating assets will remain at the core of ORIT's portfolio because they generate the cash that supports the dividend. Alongside them, selective construction-stage investments and developer relationships can provide access to future projects and additional sources of return.
We also see opportunities to create value within the existing portfolio through battery co-location, other hybridisation and repowering. During the remainder of this financial year, our work in this area will be focused on identifying the assets which offer the best near-term prospects for crystallising this value, and creating detailed implementation plans for those assets. These opportunities reinforce our conviction in the long-term case for renewable infrastructure.
Our near-term areas of focus are:
● Carefully assess new investments against other potential uses of capital and the ORIT 2030 strategy, and where appropriate progress these to completion
● Reduce gearing towards its medium-term anchor through completion of asset recycling
● Deliver the identified operational improvements within the existing portfolio
We remain convinced that disciplined delivery of ORIT 2030 is the right way to demonstrate ORIT's underlying value and support long-term shareholder returns. Progress against these areas of focus will be our measure of success during the remainder of the year.
Portfolio Breakdown
(as at 30 June 2026)
£856m
Total value of all investments
Portfolio composition on a total value of all investments in line with the Company's investment policy as at 30 June 2026. The investments are valued on an unlevered basis and including amounts committed but not yet incurred.
Portfolio breakdown by total value of all investments (£m)
Country
|
|
H1 2026 |
H1 2025 |
|
UK |
37% |
36% |
|
Ireland |
23% |
23% |
|
France |
18% |
17% |
|
Finland |
12% |
13% |
|
Germany |
6% |
7% |
|
Developer |
5% |
4% |
Country exposure remained broadly unchanged over the period on both a percentage of investments basis and percentage of MW.
Technology
|
|
H1 2026 |
H1 2025 |
|
Solar |
50% |
49% |
|
Onshore wind |
32% |
34% |
|
Offshore wind |
13% |
13% |
|
Developer |
5% |
4% |
Technology mix remained broadly unchanged over the period on both a percentage of investments basis and percentage of MW.
Asset phase
|
|
H1 2026 |
H1 2025 |
|
Operational |
95% |
96% |
|
Developer |
5% |
4% |
The asset phase breakdown remained broadly the same over the period.
Note: Outer ring as at 30 Jun 2026, inner ring as at 31 Dec 2025
Sums may not add up due to rounding
740 MW
Capacity owned
Portfolio composition broken down by MW of capacity pro rata for ORIT's ownership on a current invested basis as at 30 June 2026.
Portfolio breakdown by capacity (MW)
Country
|
|
H1 2026 |
H1 2025 |
|
UK |
34% |
34% |
|
Ireland |
33% |
33% |
|
France |
19% |
19% |
|
Finland |
10% |
10% |
|
Germany |
5% |
5% |
|
Developer |
NA |
NA |
Country exposure remained broadly unchanged over the period on both a percentage of investments basis and percentage of MW.
Technology
|
|
H1 2026 |
H1 2025 |
|
Solar |
70% |
70% |
|
Onshore wind |
24% |
24% |
|
Offshore wind |
6% |
6% |
|
Developer |
NA |
NA |
Technology mix remained broadly unchanged over the period on both a percentage of investments basis and percentage of MW.
Asset phase
|
|
H1 2026 |
H1 2025 |
|
Operational |
100% |
100% |
|
Developer |
NA |
NA |
|
Construction |
NA |
NA |
The asset phase breakdown remained the same over the period.
Note: Outer ring as at 30 Jun 2026, inner ring as at 31 Dec 2025
Sums may not add up due to rounding
Offtaker
Having multiple offtakers offers advantages such as risk diversification and offers local expertise in ORIT's key geographical markets.
O&M provider
A diversified group of O&M providers allows ORIT to leverage competitive pricing and specialised expertise.
Portfolio Performance
Operational portfolio technical and financial performance
|
|
H1 2026 |
|
|
|
|
compensated |
H1 2026 variance |
H1 2026 variance |
|
|
generation (MWh) |
against the budget |
against H1 2025 |
|
Solar |
270,533 |
2.8% |
-8.0% |
|
Onshore wind |
262,957 |
-6.0% |
-9.7% |
|
Offshore wind |
80,242 |
5.4% |
17.5% |
|
Total |
613,732 |
-0.9% |
-6.1% |
Note: Year-on-year comparisons are on a reported basis and reflect changes in the operational portfolio following the disposal of Crossdykes and the partial disposal of Breach in December 2025. The H1 2026 budget has been updated to reflect the revised energy yield forecasts completed in Q2.
In the six months to 30 June 2026, total portfolio generation was 6.1% lower than H1 2025, principally reflecting the partial disposal (49%) of ORIT's ownership of Breach solar farm and the full disposal of its 51% interest in Crossdykes onshore wind farm at the end of 2025. Versus budget for H1 2026 generation was broadly in line, representing an improvement on H1 2025 when generation was 6.1% below budget.
Solar and offshore wind exceeded budget by 2.8% and 5.4%, respectively, driven primarily by favourable weather conditions. While the UK onshore wind portfolio also experienced stronger wind resource, this was offset by below‑forecast wind conditions in France, Germany and Finland. Together with economic curtailment and a few technical issues, this resulted in onshore wind generation ending the period 6.0% below budget.
Revenue and EBITDA:
Operational portfolio revenue of £67.2 million was 3% ahead of budget. This reflects the stable performance of the solar portfolio, while the offshore wind portfolio, and to a lesser extent the onshore wind portfolio, were able to benefit from higher than budgeted power prices during the period. While performance was 2% below H1 2025, this is a result of the disposals made in December 2025, as mentioned above.
EBITDA of £42.1 million was 5% lower than H1 2025 but exceeded budget by 6%, demonstrating the resilience of the portfolio despite lower overall generation. Offshore wind delivered the strongest relative performance during the period, while onshore wind reflected the weaker generation.
Figure 3: Performance of the Company's underlying operational investments
|
|
Output1 |
Revenue |
Opex |
EBITDA |
|
Operational portfolio |
614 GWh |
£67.2m |
£25.1m |
£42.1m |
|
-6% vs H1 2025 |
-2% vs H1 2025 |
+3% increase vs |
-5% vs H1 2025 |
|
|
-1% vs budget |
+3% vs budget |
H1 2025 |
+6% vs budget |
|
|
(H1 2025: 654 GWh) |
(H1 2025: £68.7m) |
-2% below budget |
(H1 2025: £44.3m) |
|
|
(H1 2025: £24.4m) |
||||
|
Solar |
271 GWh |
£30.2m |
£7.9m |
£22.3m |
|
-8% vs H1 2025 |
-9% vs H1 2025 |
+1% increase vs |
-12% vs H1 2025 |
|
|
+3% vs budget |
+2% vs budget |
H1 2025 |
+4% vs budget |
|
|
(H1 2025: 294 GWh) |
(H1 2025: £33.1m) |
-2% below budget |
(H1 2025: £25.3m) |
|
|
|
|
(H1 2025: £7.8m) |
|
|
|
Onshore wind |
263 GWh |
£13.4m |
£4.9m |
£8.5m |
|
-10% vs H1 2025 |
-20% vs H1 2025 |
+2% increase vs |
-29% vs H1 2025 |
|
|
-6% vs budget |
-3% vs budget |
H1 2025 |
-2% vs budget |
|
|
(H1 2025: 291 GWh) |
(H1 2025: £16.7m) |
-4% below budget |
(H1 2025: £11.9m) |
|
|
|
|
(H1 2025: £4.8m) |
|
|
|
Offshore wind |
80 GWh |
£23.6m |
£12.3m |
£11.3m |
|
+18% vs H1 2025 |
+25% vs H1 2025 |
+4% increase vs |
+59% vs H1 2025 |
|
|
+5% vs budget |
+7% vs budget |
H1 2025 |
+18% vs budget |
|
|
(H1 2025: 68 GWh) |
(H1 2025: £18.9m) |
-2% below budget |
(H1 2025: £7.1m) |
|
|
|
|
(H1 2025: £11.8m) |
|
1 Generation quoted is post-compensation (actual output + compensation for equivalent lost production ORIT is entitled to under curtailment and/or contractual mechanisms). Totals may not sum due to rounding.
Solar
The solar portfolio generated 271 GWh during H1 2026, which is 2.8% above budget. The principal driver was higher-than-expected irradiance, with above-average levels recorded across all three countries in which ORIT's solar assets operate: the UK, Ireland and France.
Dispatch-down losses in Ireland were lower than budgeted during the period. Dispatch down occurs when renewable energy generators are instructed by the grid to reduce their electricity output. In H1 2026 approximately 12 GWh of generation was lost due to dispatch down, 7 GWh less than budgeted (see Figure 4). These losses may become eligible for compensation depending on the outcome of the proceedings before the Court of Justice of the European Union, with a decision expected later this year.
The portfolio experienced a small number of technical faults and outages during the period, resulting in some downtime. None were individually significant; all were resolved during the period and we are addressing outstanding efficiency losses.
Although operational performance vs budget was better in H1 2026, (+2.8% vs budget) when compared with the same period last year (on budget), to the same period last year (on budget), total generation was lower than in H1 2025 by 23 GWh, primarily reflecting the partial disposal of Breach solar farm, and the continued shutdown of the Cuges site in France. The budget assumed that Cuges would return to operation by the end of Q2 2026. However, following delays in finalising the contractual arrangements, repowering is now expected to be completed by the end of the year. All required contracts have now been secured, the replacement modules have been delivered to site and the EPC contractor is mobilising.
Figure 4: H1 2026 solar output variance to budget (GWh)
|
|
GWh |
|
Budget |
263.3 |
|
Weather variance |
13.8 |
|
Cuges shut down |
−1.8 |
|
Other |
−14.1 |
|
Dispatch down balance (Ireland) |
7.2 |
|
Exported generation |
268.3 |
|
Compensated generation |
2.2 |
|
Total generation |
270.5 |
Totals may not sum due to rounding.
Onshore wind
Generation from the onshore wind portfolio was 6.0% below budget during H1 2026, representing a shortfall of approximately 17 GWh. This represents an improvement compared to the same time last year when we experienced -16% underperformance. Economic curtailment was the largest source of gross lost generation, accounting for approximately 30 GWh. This principally arose from Balancing Mechanism instructions and periods of negative pricing. The majority of these losses were compensated.
Turbine faults resulted in a further 15 GWh of lost export, of which 12 GWh related to blade and main-bearing issues at Saunamaa and Suolokangas. Most of the repairs have been completed and the underlying issues resolved, while a few outstanding faults are being addressed. Approximately 9 GWh of the generation lost through technical faults was compensated under contractual protections.
In H1 2026 wind conditions varied across the portfolio: the UK experienced wind speeds above forecast, while conditions across the other geographies were below budget. The cumulative impact of wind conditions across the portfolio was therefore negative. Generation was 28 GWh lower than in H1 2025, mainly reflecting the disposal of Crossdykes in the second half of 2025.
Figure 5: H1 2026 onshore wind output variance to budget (GWh)
|
|
GWh |
|
Budget |
279.8 |
|
Weather variance |
-4.0 |
|
Economic curtailment |
−29.8 |
|
Turbine faults |
−15.6 |
|
Other |
-3.9 |
|
Exported generation |
226.6 |
|
Compensated generation |
36.3 |
|
Total generation |
263.0 |
Totals may not sum due to rounding.
Offshore wind
Generation from the offshore wind portfolio was 5.4% above budget during H1 2026, representing an uplift of approximately 4 GWh. This outperformance was driven by favourable wind conditions, which more than offset production losses arising from planned maintenance and technical outages. Generation in H1 2026 was 12 GWh higher than in H1 2025.
Technical availability was affected by a number of corrective and breakdown outages, particularly during the early months of the year. The most significant events included several gearbox and generator breakdowns. These faults were successfully resolved during the period.
Figure 6: H1 2026 offshore wind output variance to budget (GWh)
|
|
GWh |
|
Budget |
76.2 |
|
Weather variance |
8.1 |
|
Technical availability |
−4.1 |
|
Exported generation |
80.2 |
Totals may not sum due to rounding.
Update on the Value Enhancement Programme
During H1 2026, ORIT advanced the Value Enhancement Programme by establishing and deploying a structured, phased framework for assessing the viability of BESS hybridisation and co-location opportunities. Developed in collaboration with ORIT's technical adviser, the framework incorporates lessons learnt from each assessment and will provide a consistent approach across the portfolio. It has been applied to the Leeskow and Cumberhead onshore wind farms, with opportunities at both assets progressing to further assessment phases. ORIT also assessed battery storage co-location across its Irish solar portfolio, where storage could potentially mitigate losses arising from grid curtailment. While the study concluded that deployment is not currently viable, regulatory developments that have been a bottleneck are changing, and ORIT continues to monitor the situation. In parallel, work is progressing to implement the findings of repowering studies across the UK ground-mounted solar portfolio.
Case study
France - Rapid response to regulatory change
Changes to the French negative pricing regime, effective from 1 April 2026, required generators above certain size to reduce or cease production when instructed during periods of negative day-ahead power prices. For legacy feed-in tariff assets, this created a risk because their control systems were not necessarily designed to deliver remote curtailment, while failure to respond could result in generation not being paid.
The OEGen asset management team began assessing the potential impact on our French solar portfolio in December 2025. The initially proposed 12 MWp threshold was reduced to 10 MWp in March, shortly before implementation, bringing more assets within the scope of the new requirements than had been anticipated. This brought five assets into scope - more than anticipated - and created a tight delivery deadline.
OEGen led a coordinated response with the external asset manager and the portfolio's O&M provider to confirm the technical feasibility of curtailing each asset and establish the required operating process. This included verifying site connectivity and assigning clear responsibilities. All five assets were ready by the April deadline.
The process was successfully tested during negative pricing periods in May and June. The sites shut down as instructed, approximately 1,070 MWh was curtailed, and compensation was received from EDF. This rapid response protected portfolio income and demonstrated effective coordination across delivery partners.
Financial Review
The financial statements of the Company for the period ended 30 June 2026 are set out on pages 49 to 55. These financial statements have been prepared in accordance with international accounting standards in conformity with the requirements of the Companies Act 2006 and the applicable legal requirements of the Companies Act 2006. In order to continue providing useful and relevant information to its investors, the financial statements also refer to the "intermediate holding companies", which comprise the Company's wholly owned subsidiary, ORIT Holdings II Limited and its indirectly held wholly owned subsidiaries, ORIT Holdings Limited, ORIT UK Acquisitions Limited and ORIT UK Acquisitions Midco Limited.
Net assets
Net assets have decreased from £494.8 million as at 31 December 2025 to £454.7 million as at 30 June 2026, primarily due to a decrease in the fair value of the portfolio of assets as described in the Portfolio Valuation section. The net assets comprise the fair value of the Company's investments and net current assets, as detailed in table 7 on the right.
Table 7: Results as at 30 June 2026
|
2026 |
2025 |
|
|
£m |
£m |
|
|
Fair value of portfolio of assets |
573.4 |
693.1 |
|
Cash held in intermediate holding companies |
2.8 |
15.3 |
|
Bank loans and accrued interest held in the intermediate holding companies |
(131.4) |
(168.4) |
|
Fair value of other net assets/(liabilities) in the intermediate holding companies |
0.4 |
(7.7) |
|
Fair value of Company's investments |
445.2 |
532.3 |
|
Company's cash |
10.6 |
0.2 |
|
Company's other net (liabilities)/assets |
(1.1) |
7.9 |
|
Net asset value as at 30 June |
454.7 |
540.4 |
|
Number of shares (million) |
527.6 |
543.4 |
|
Net asset value per share (pence) |
86.18 |
99.46 |
Income
In accordance with the Statement of Recommended Practice: Financial Statements of Investment Trust Companies and Venture Capital Trusts ("SORP") issued in December 2025 by the Association of Investment Companies ("AIC"), the statement of comprehensive income differentiates between the 'revenue' account and the 'capital' account, and the sum of both items equals the Company's (loss)/profit for the period. Items classified as capital in nature either relate directly to the Company's investment portfolio or are costs deemed attributable to the long-term capital growth of the Company (such as a portion of the Investment Manager's fee).
Details of the Company's income can be found in the Statement of Comprehensive Income and supporting notes.
Ongoing charges
The ongoing charges ratio ("OCR") is a measure, expressed as a percentage of average net assets, of the regular, recurring annual costs of running the Company. It has been calculated and disclosed in accordance with the AIC methodology, as annualised ongoing charges (i.e. excluding acquisition costs and other non-recurring items) divided by the average published undiluted Net Asset Value in the year. For the year ended 31 December 2025, the ratio was 1.22% and it is anticipated that the full-year ratio for the year ended 31 December 2026 will be 1.13%.
Debt
No debt is held on the Company's balance sheet. However, the Group's debt structure continues to consist of three key components:
1. RCF: A short term, flexible revolving credit facility held by the Company's immediate 100% subsidiary
2. UK HoldCo Facility: A five-year bullet repayment facility secured against a portfolio of UK operational assets
3. Project Term Loans: Long-term amortising debt facilities secured at the individual asset level
ORIT continues to actively manage its capital structure in line with its disciplined approach to capital allocation. During the six months ended 30 June 2026, ORIT focused on making repayments of project-level debt facilities. Despite the reduction in absolute debt, gearing marginally increased as NAV and GAV also declined over the period.
Table 8: Debt summary (look-through basis)
|
30 June 2026 |
30 June 2025 |
|
|
Debt as a % of GAV |
47% |
47% |
|
% hedged |
72% |
71% |
|
Average cost of debt |
3.5% |
3.6% |
|
Average remaining term (years) |
9.3 |
10.3 |
Dividends
During the six months to 30 June 2026, interim dividends totalling £16.4 million were paid - 1.55p per share paid in respect of the quarter to 31 December 2025 (paid in February 2026) and 1.55p per share in respect of the first quarter of 2026 (paid in May 2026).
Post-period end, a further interim dividend of 1.56p per share was paid on 1 September 2026, to shareholders recorded on the register on 14 August 2026, in respect of the quarter ended 30 June 2026.
Dividend cover - operational cash flows (portfolio level)
For the first half of 2026, the Company's net cash flows from operations of £31.4 million pre-scheduled debt amortisation and £22.6 million post external debt amortisation, supported the payment of £16.4 million in dividends to shareholders for the period, resulting in a dividend coverage of 1.91x and 1.38x respectively.
ORIT's key portfolio characteristics of diversification, high proportion of fixed revenues and inflation-linkage help maintain a growing, covered dividend.
Full year dividends, based on the stated target of 6.23 pence per share1, are expected to remain fully covered for the full year. While the Company remains confident in its ability to meet its dividend targets for the year, actual coverage will ultimately depend on a range of factors, including asset level performance, power market conditions and the scale and timing of further buybacks. The Investment Manager continues to monitor these dynamics closely as part of its active portfolio and capital management strategy.
|
30 June 2026 |
30 June 2025 |
|
|
Six-months ended |
£m |
£m |
|
Operational cash flows |
42.2 |
43.2 |
|
SPV level taxes |
-1.1 |
-1.0 |
|
Interest payable on external debt |
-3.8 |
-4.5 |
|
Operational cash flow pre debt amortisation |
37.3 |
37.8 |
|
Company and intermediate holding company level expenses |
-2.0 |
-1.0 |
|
Interest and fees payable on RCF and short-term facility |
-3.9 |
-6.3 |
|
Net cash flow from operating activities pre debt amortisation |
31.4 |
30.5 |
|
Dividends paid in respect of the period |
16.4 |
16.8 |
|
Portfolio level operational cash flow dividend cover pre debt amortisation |
1.91x |
1.8x |
|
External debt amortisation |
-8.8 |
-10.5 |
|
Net cash flow from operating activities |
22.6 |
20.0 |
|
Dividends paid in respect of year |
16.4 |
16.8 |
|
Portfolio level operational cash flow dividend cover |
1.38x |
1.19x |
1 The dividend target is a target only and not a profit forecast. There can be no assurance that this target will be met, or that the Company will make any distributions at all and it should not be taken as an indication of the Company's expected future results. The Company's actual returns will depend upon a number of factors, including but not limited to the Company's net income and level of ongoing charges. Accordingly, potential investors should not place any reliance on this target and should decide for themselves whether or not the target dividend is reasonable or achievable. Investors should note that references in this announcement to "dividends" and "distributions" are intended to cover both dividend income and income which is designated as an interest distribution for UK tax purposes and therefore subject to the interest streaming regime applicable to investment trusts.
Portfolio Valuation
|
£454.7m |
86.2p |
£852m |
£856m |
|
Net Asset Value (31 December 2025: £494.8m) |
NAV per Ordinary Share (31 December 2025: |
Gross Asset Value (31 December 2025: |
Total value of all investments |
|
(31 December 2025: £908m) |
Figure 9 Plc NAV Bridge
Portfolio Valuation
The Company's portfolio is valued quarterly in accordance with its valuation policy.
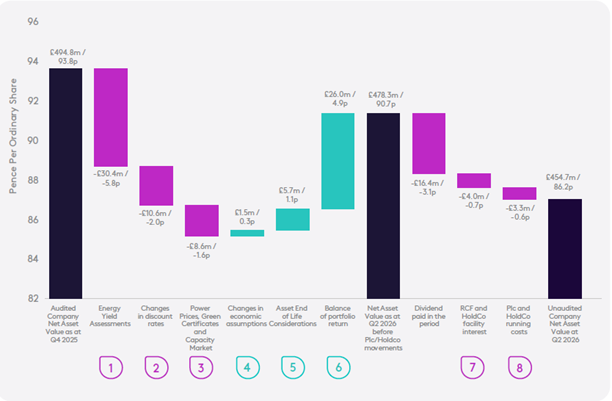
As at 30 June 2026, the Company's Net Asset Value was £454.7 million, equivalent to 86.18 pence per Ordinary Share, compared with £494.8 million, or 93.79 pence per Ordinary Share, at 31 December 2025.
During the period, updated energy yield assessments, discount rates and market price assumptions reduced NAV by an aggregate 9.4 pence per Ordinary Share. These movements were partially offset by the expected return on the portfolio, changes to end-of-life assumptions and other valuation movements, resulting in a net reduction of 3.1 pence per Ordinary Share before plc and Holding Company movements. Dividends paid, financing costs and running costs reduced NAV by a further 4.4 pence per Ordinary Share.
|
£m |
pps |
|
|
Audited Company Net Asset Value as at Q4 2025 |
494.8 |
93.79 |
|
Energy Yield Assessments |
(30.4) |
(5.77) |
|
Changes in discount rates |
(10.6) |
(2.00) |
|
Power Prices, Green Certificates and Capacity Market |
(8.6) |
(1.64) |
|
Changes in economic assumptions |
1.5 |
0.28 |
|
Asset End of Life Considerations |
5.7 |
1.08 |
|
Balance of portfolio return |
26.0 |
4.92 |
|
Net Asset Value as at Q2 2026 before Plc/Holdco movements |
478.3 |
90.66 |
|
Dividend paid in the period |
(16.4) |
(3.10) |
|
RCF and HoldCo facility interest |
(4.0) |
(0.75) |
|
Plc and HoldCo running costs |
(3.3) |
(0.62) |
|
Unaudited Company Net Asset Value at Q2 2026 |
454.7 |
86.18 |
1 Energy yield assessments
(-5.8 pence per Ordinary Share)
When renewable energy projects are first valued, long-term generation assumptions are based principally on pre‑construction engineering assessments. As assets mature and establish a sufficient operational track record, it is standard market practice to review these assumptions using operational performance and the latest technical evidence. Consistent with this approach, the Investment Manager completed a comprehensive review of the long‑term energy yield assumptions across the Company's operational onshore wind portfolio during the period.
The review incorporated operational performance data, updated technical analysis, long-term weather information, engineering judgement and input from the Technical and Asset Management teams. Where appropriate, long-term energy yield assumptions were updated to reflect each asset's operational track record and current technical assessment.
The review resulted in an aggregate reduction in portfolio value of £30.4 million. The revised assumptions reflect management's best estimate of long-term generation at the valuation date and represent an update to structural, long-term generation expectations rather than an adjustment for short-term weather variability.
The largest valuation reductions related to the Finnish and German wind portfolios, where values reduced by £10.2 million and £10.8 million, respectively.
No equivalent update was made to the Company's offshore wind or solar portfolios. The offshore wind assets are already valued using mature operational assumptions, while the solar portfolio either continues to perform broadly in line with existing energy yield assumptions or does not yet have sufficient operational history to support a meaningful reassessment. The Investment Manager will continue to review long-term energy yield assumptions across the portfolio as assets mature and additional operational evidence becomes available.
|
UK |
Ireland |
France |
Finland |
Germany |
Totals |
|
|
Generation |
505,937 |
235,014 |
244,967 |
283,886 |
78,215 |
1,348,020 |
|
New generation |
486,793 |
235,014 |
240,678 |
260,534 |
61,361 |
1,284,381 |
|
Percentage change |
-3.8% |
0.0% |
-1.8% |
-8.2% |
-21.5% |
-4.7% |
2 Changes in discount rates
(-2.0 pence per Ordinary Share)
Discount rates were updated following the Investment Manager's review of market evidence, transaction benchmarks and financing conditions, reducing portfolio value by 2.0 pence per Ordinary Share.
Discount rates increased by 25 basis points across the Company's Irish, French and German assets and by 50 basis points for the Finnish wind portfolio. These changes reflected sustained changes in market conditions and evolving transaction evidence observed during the period. As a result, the portfolio weighted average discount rate increased from 7.8% at 31 December 2025 to 8.3% at 30 June 2026. The adjusted weighted average discount rate increased from 8.2% to 8.8%.
|
30-Jun-26 |
31-Dec-25 |
|
|
UK Assets |
||
|
Levered IRR (GBP) |
8.3% |
8.1% |
|
Gross Asset Value (GAV) (£m) |
404 |
408 |
|
Asset Leverage %GAV |
21% |
19%1 |
|
European Assets |
||
|
Levered IRR (GBP) |
8.0% |
7.0% |
|
Levered IRR (EUR) |
7.5% |
6.5% |
|
Gross Asset Value (GAV) (£m) |
447 |
489 |
|
Asset Leverage %GAV |
27% |
25%1 |
|
Total Portfolio |
||
|
Levered IRR (GBP) |
8.3% |
7.8% |
|
Levered IRR (local currency) |
7.8% |
7.3% |
|
Gross Asset Value (GAV) (£m) |
852 |
897 |
|
Total Leverage %GAV |
47% |
45% |
|
Weighted average discount rate |
8.3% |
7.8% |
|
(i) Return expected on the Company's investments into development stage assets |
0.4% |
0.3% |
|
(ii) Increase in return associated with the additional leverage from the RCF |
0.1% |
0.1% |
|
Adjusted average discount rate |
8.8% |
8.2% |
1 Differs from the figure reported in the Company's 2025 Annual Report and Accounts as this is now calculated as a % of total GAV.
3 Power prices and other energy markets
(-1.6 pence per Ordinary Share)
Updates to wholesale electricity price forecasts and other energy market assumptions reduced portfolio value by a net £8.6 million during the period.
Medium to long-term wholesale electricity price forecasts reduced portfolio value by £9.7 million, principally reflecting lower price expectations in the UK and Ireland driven by expectations of increased renewable generation deployment and lower long-term gas prices. The UK Government's decision not to extend Carbon Price Support beyond the current legislative period resulted in a further £1.8 million reduction in value. These movements were partially offset by a £2.6 million uplift from higher short-term forward power prices.
Lower Green Certificate price assumptions were largely offset by stronger long-term Irish Capacity Market forecasts, resulting in a net increase in portfolio value of £0.3 million.
4 Changes in economic assumptions
(+0.3 pence per Ordinary Share)
Changes in economic assumptions increased NAV by 0.3 pence per Ordinary Share during the period. Positive impacts from higher inflation assumptions and movements in the mark-to-market value of the Company's foreign exchange hedges were partially offset by adverse spot foreign exchange movements, higher interest rate assumptions and revised French tax assumptions affecting the solar portfolio.
5 Asset End-of-life considerations
(+1.1 pence per Ordinary Share)
Updates to end-of-life assumptions increased portfolio value by £5.7 million.
This comprised a £3.3 million uplift from extending the assumed operational lives of selected onshore wind assets and a £2.4 million uplift from revised decommissioning assumptions.
Where operational lives were extended, cash flows arising during the extension period were discounted using an additional 500 basis point premium. This reflects the greater uncertainty associated with long-term planning, land rights, technical performance and continued operation beyond the previously assumed asset life.
The Investment Manager also completed a review of end-of-life assumptions across the portfolio. Following benchmarking against prevailing market practice, the valuation now assumes that, where appropriate, residual equipment values for onshore wind and solar assets broadly offset expected decommissioning costs.
6 Balance of portfolio return
(+4.9 pence per Ordinary Share)
This refers to the balance of portfolio valuation movements during the first half of 2026, excluding the principal factors described above, and represents a net increase of 4.9 pence per Ordinary Share.
The movement principally reflects 3.6 pence per Ordinary Share from the expected return on the portfolio as assets moved six months closer to the receipt of future cash flows. The remaining increase reflects routine valuation updates, including operational performance and other asset-level assumption reviews.
7 Financing costs
(-0.7 pence per Ordinary Share)
Financing costs reduced NAV by 0.7 pence per Ordinary Share during the period. This principally reflects interest and commitment fees associated with the Company's Revolving Credit Facility ("RCF"), together with financing costs relating to the UK HoldCo facility.
8 Running costs
(-0.6 pence per Ordinary Share)
Management fees and corporate costs at the plc and HoldCo level.
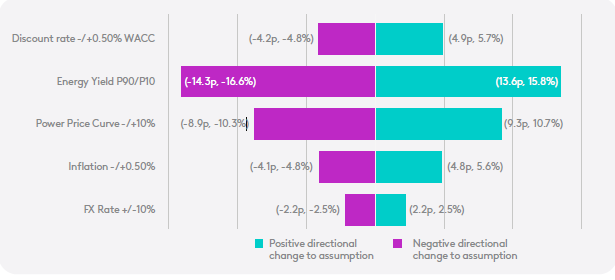
Sensitivity Chart
Revenue Management
Debt management
During the first half of 2026, the Company continued to actively manage its capital structure, reducing total debt by £5.3 million to £396.8 million. Scheduled amortisation reduced project level debt by £8.8 million. In addition a further £9 million of long-term project level debt was voluntarily pre-paid during the period. This debt reduction was partially offset by increased utilisation of the Revolving Credit Facility. A wider refinancing of certain project-level term loans is being considered for completion in 2027, in order to maximise the Company's flexibility in delivering the ORIT 2030 strategy. As a result of the reduction in Gross Asset Value following the valuation movements described above, gearing increased from 44.8% at 31 December 2025 to 46.6% at 30 June 2026. The Board and Investment Manager remain focused on reducing gearing over the medium term through disciplined capital allocation and the application of future asset sale proceeds towards debt repayment.
|
Project-level |
UK Holdco |
|||
|
30 June 2026 |
Total |
term loans |
facility |
RCF |
|
Current Debt / Current GAV |
46.6% |
31.2% |
9.0% |
6.5% |
|
Committed Debt / Committed GAV |
46.9% |
31.0% |
8.9% |
7.0% |
|
Amount £m |
396.8 |
265.5 |
76.3 |
55.1 |
|
% Hedged |
71.8% |
85.5% |
75.0% |
0.0% |
|
Average cost of debt |
3.5% |
2.5% |
5.1% |
5.4% |
|
Average remaining term (years) |
9.3 |
12.9 |
3.8 |
2.0 |
Generation-Weighted Price
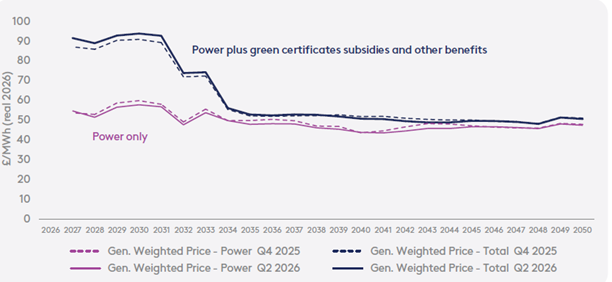
While downward revisions to wholesale power price forecasts impacted asset valuations this period, the portfolio's resilient generation-weighted price (Figure 10) demonstrates the value of ORIT's active revenue risk management. The short‑ and long-term PPAs originated by the Investment Manager continue to heavily insulate the portfolio from this market volatility. Furthermore, our geographic and technological diversification provides another layer of protection. On a shorter-term basis, the portfolio has benefited from near‑term increases in power forwards due to the ongoing conflict in Iran.
The generation-weighted price ("GWP") represents the average electricity price expected to be achieved by the portfolio over its remaining life, taking into account forward market prices, independent long-term power price forecasts, contracted revenues and power purchase agreements originated by the Investment Manager.
The Total GWP also incorporates subsidies and other contracted revenue streams, including green certificates. Figure 8 illustrates the forecast Power-only and Total GWP to 2050. The Total GWP has shown a slight increase, owing to downward revisions to the energy yield assessments of ORIT's onshore wind assets, many of which do not have subsidies, therefore increasing the proportion of the portfolio receiving revenues in excess of power only prices.
Figure 10: Generation-Weighted Price
Baseload and Capture Price Discount Forecasts
A key factor in the GWP is the capture price discount. Renewable generators typically receive prices that differ from average wholesale ("baseload") electricity prices because they generate electricity at different times of the day and year. Understanding these discounts is therefore important in assessing long-term portfolio revenues. A summary of the capture price discounts utilised in the assets' valuations is presented below in Figure 101. The percentages are the average differences between the generation-weighted and time-weighted power prices.
Figure 11: Baseload price and capture discount forecasts
|
Value |
Market |
Technology |
Units |
2026-2029 |
2030-2034 |
2035-2039 |
2040-2044 |
2045-2050 |
|
Baseload price |
GB |
£/MWh (real 2026) |
79 |
73 |
75 |
71 |
68 |
|
|
Capture price discount |
GB |
Solar |
% |
24% |
28% |
27% |
29% |
32% |
|
Capture price discount |
GB |
Onshore Wind |
% |
14% |
19% |
22% |
24% |
25% |
|
Capture price discount |
GB |
Offshore Wind |
% |
12% |
19% |
21% |
24% |
24% |
|
Baseload price |
FR |
€/MWh (real 2026) |
73 |
80 |
80 |
77 |
||
|
Capture price discount |
FR |
Onshore Wind |
% |
12% |
12% |
|||
|
Capture price discount |
FR |
Solar |
% |
43% |
42% |
41% |
41% |
|
|
Baseload price |
FI |
€/MWh (real 2026) |
50 |
65 |
67 |
66 |
67 |
|
|
Capture price discount |
FI |
Onshore Wind |
% |
16% |
17% |
22% |
24% |
24% |
|
Baseload price |
DE |
€/MWh (real 2026) |
82 |
81 |
||||
|
Capture price discount |
DE |
Onshore Wind |
% |
27% |
29% |
|||
|
Baseload price |
I-SEM |
€/MWh (real 2026) |
88 |
89 |
||||
|
Capture price discount |
I-SEM |
Solar |
% |
23% |
24% |
Capture price assumptions are developed by independent third-party advisers and reflect individual asset characteristics, market conditions and technology type. These assumptions continue to be reviewed regularly as generation profiles evolve and additional operational data becomes available.
1 Note: Values in the table are not shown where the relevant asset has no merchant exposure in three or more years in the relevant period.
Portfolio Revenue Forecasts
Figure 12 presents ORIT's forecast revenues through to 2050, categorised by price structure. The revenues are categorised as fixed via either subsidy (Fixed - Subsidy) or fixed price PPA (Fixed - Power) and the variable revenues derive from power being sold on a merchant basis (Variable - Power) or from other sources of variable revenue (Variable - Other).
This forecast highlights three key components of ORIT's portfolio:
Near-term revenue certainty:
For the 24 months up to 30 June 2028, 86% of ORIT's forecast revenues are fixed. The decrease of 2 percentage points compared with ORIT's position six months prior is primarily due to higher wholesale prices arising due to the ongoing conflict in Iran, which increases the forecast value of variable price revenues. On a present-value basis, 49% of the portfolio's total value derives from fixed price revenues and 51% from variable price revenues.
Eliminating power buyback risk via pay-as-produced hedges:
Importantly, 100% of ORIT's power price hedges are structured on a pay-as-produced basis unlike baseload or fixed‑shape hedges, which force assets to purchase expensive market power if they underproduce (often during a price spike). This eliminates a significant and costly downside risk for our investors.
Embedded inflation protection:
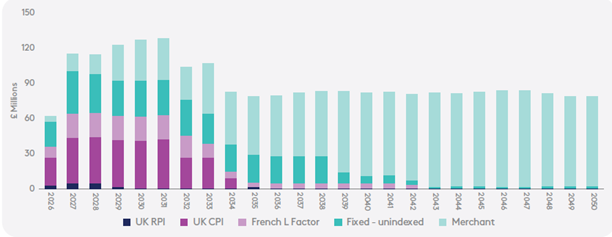
The portfolio provides a strong hedge against macroeconomic volatility through high proportions of contractually inflation‑linked revenues (see Figure 13). Driven by government subsidies and bespoke corporate PPAs (such as our agreement between Breach solar farm and Iceland Foods), 42% of our forecast revenues over the next 10 years are directly linked to inflation. The one percentage point decrease from six months prior reflects the natural progression of the 10-year look-forward period as subsidies and PPAs move closer to expiry.
Figure 12: Fixed vs variable revenue forecast (as at 30 June 2026)
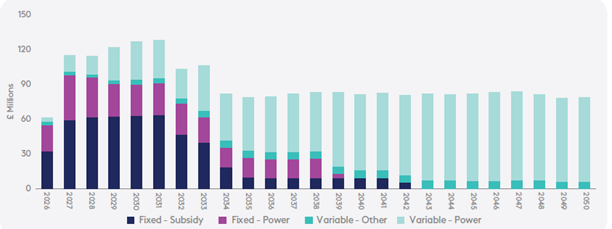
Figure 13: Inflation-linked revenue forecast (as at 30 June 2026)
ESG & Impact Report
ESG & Impact Strategy
ORIT classifies itself an impact fund with a core impact objective to accelerate the transition to net zero through its investments, building and operating a diversified portfolio of renewable energy assets.
ORIT enables individuals and institutions to participate in the energy transition. The renewable energy generated from its portfolio of assets supports the transition to net zero by replacing unsustainable energy sources with clean power. This intended outcome is the Company's core impact objective.
The ESG & Impact Strategy considers ORIT's culture, values and activities through three lenses: Performance, Planet and People - to ensure that ORIT's activities integrate ESG risks and promote additional impact opportunities.
For a more in-depth understanding of ORIT's ESG & Impact Strategy, encompassing definitions of ESG and Impact, along with detailed insights into four impact themes: stakeholder engagement, equality and wellbeing, innovation, and sustainable momentum, please refer to the separately published ESG & Impact Strategy.
Stewardship and Engagement
The Investment Manager manages ORIT's investments in line with its Engagement and Stewardship Policy. More detail can be found in the Company's 2025 Annual Report on page 30 and the Investment Manager's full Engagement and Stewardship Policy can be viewed here1.
Regulatory Disclosures
ORIT is a supporter of the recommendations of the Task Force on Climate-related Financial Disclosures ("TCFD") and makes a TCFD disclosure in its 2025 Annual Report on page 37.
ORIT is classified as an Article 9 product under the EU Sustainable Finance Disclosure Regulation ("SFDR"). ORIT's most recent SFDR-related disclosures, including its Principal Adverse Impact Statement, are available on its website2.
The breakdown of ORIT's investments' alignment to the EU Taxonomy can be found in the 2025 Annual Report on page 116.
2 https://www.octopusrenewablesinfrastructure.com/sustainability- related-disclosures
|
Objective & Commitments |
Metrics |
H1 2026 |
H1 2025 |
|
Performance |
|||
|
Build and operate a diversified portfolio of renewable energy assets, mitigating the risk of losses through robust governance structures, rigorous due diligence, risk analysis and asset optimisation activities to deliver investment return resilience and the maximum amount of green energy. |
Total value of sustainable investments, 100% of which committed into renewables |
£856m |
£1,026m |
|
Number of assets |
39 |
40 |
|
|
% investments that adhere to ORIT ESG policy and minimum ESG matrix threshold |
100% |
100% |
|
|
Renewable energy generated in H1 (excluding compensated generation) |
575 GWh |
608 GWh |
|
|
Potential annual renewable energy generation once fully operational |
1,257 GWh |
1,397 GWh |
|
|
Potential annual renewable energy generation from assets where ORIT has invested and committed at construction |
772 GWh |
832 GWh |
|
|
Planet |
|||
|
Consider environmental factors to mitigate risks associated with the construction and operation of assets, enhancing environmental potential where possible. |
In reference to renewable energy generated in H1 |
||
|
Estimated annual equivalent tonnes of CO2 avoided in H1 |
154k |
165k |
|
|
Estimated equivalent new trees required to avoid same CO2 in H1 |
0.8m |
0.8m |
|
|
Estimated equivalent cars off the road to avoid the same CO2 in H1 |
75k |
82k |
|
|
In reference to potential annual generation once fully operational |
|||
|
Estimated equivalent tonnes of CO2 avoided once fully operational |
340k |
384k |
|
|
Estimated equivalent new trees required to avoid same CO2 once fully operational |
1.7m |
1.9m |
|
|
Estimated equivalent cars off the road required to avoid same CO2 once fully operational |
166k |
190k |
|
|
Other environmental metrics |
|||
|
ORIT LSE Green Economy Mark demonstrating Company's significant contribution to transition to a zero-carbon economy. |
✔ |
✔ |
|
|
% Generating sites on renewable import tariffs |
94% |
94% |
|
|
Number of environmental incidents |
0 |
1 |
|
|
People |
|||
|
Evaluate social considerations to mitigate risks and promote a 'Just Transition' to clean energy. This includes: • Effectively managing ORIT's health and safety risks. • Ensuring diversity and inclusion in board appointments and subsidiary directorships. • Supporting decent jobs that uphold equal opportunity, workplace standards, diversity, and local employment. • Empowering communities through benefit schemes, school engagement, local charity support, and early stakeholder engagement to build social license. • Delivering affordable, clean energy to enhance energy security and reduce costs for end users. |
Health and Safety |
||
|
RIDDORs |
0 |
0 |
|
|
Lost time injuries (>7 days) |
0 |
0 |
|
|
Near misses |
4 |
5 |
|
|
Personal Injuries (first aid) |
2 |
4 |
|
|
Minor equipment damage incidents |
8 |
4 |
|
|
Diversity & Inclusion |
|||
|
Compliance with the FCA's Diversity and inclusion targets for Company boards |
✔ |
✔ |
|
|
Just Transition |
|||
|
Estimated FTE jobs supported1 |
36 |
42 |
|
|
£ per year of community benefit funds |
£816,154 |
£1,013,000 |
|
|
£ of annual impact budget |
£328,680 |
£343,000 |
|
|
Number of people benefiting from social initiatives2 |
16,853 |
4,034 |
|
|
Estimated equivalent homes powered by renewable electricity generation by ORIT's assets in H1. |
153k |
158k |
|
1 Reduction caused by ORIT reducing effective ownership of Simply Blue from 19% to 4% (subsequent reduction to 1.8 FTE from 10.3).
2 Both H1 2025 and H1 2026 metrics encompass both student beneficiaries and all other beneficiary groups.
Case study
Inspiring the Next Generation of Net Zero
Innovators through LAB45
As part of its commitment to delivering social impact alongside renewable energy investment, ORIT partnered with Bonanza Creative to launch LAB45, an innovative education programme designed to inspire young people to engage with the transition to net zero.
Targeting pupils in the first three years of secondary school, LAB45 combines immersive films, interactive workshops and creative challenges to make climate action and sustainability engaging and accessible. Students work together to develop and pitch innovative solutions to real-world environmental challenges, building confidence, teamwork and problem-solving skills.
Programme highlights:
· Engaged 1,030 pupils through 40 workshops delivered between March and June 2026
· Partnered with 6 secondary schools located near Crossdykes and Cumberhead Wind Farms
· Supported students in developing and pitching around 300 sustainability-focused ideas
· All participating schools requested follow-on sessions following the pilot programme
By strengthening environmental awareness, communication skills and creativity, LAB45 is helping empower the next generation of climate leaders while building lasting relationships with the communities surrounding ORIT's renewable energy assets
For the full impact story, please visit: www.octopusrenewablesinfrastructure.com/esg-impact-case-studies
4 - QUALITY EDUCATION
4.1, 4.5 & 4.7 - Provide free, quality education leading to effective learning outcomes that can also promote sustainable development. Implement this whilst eliminating gender disparities and ensuring equal access to all levels of education
Long-term partnership with the Good Bee Company and Earth Energy Education and Bonanza Creative, to provide free education programmes and site visits to local schools. Funding of multiple charities through BizGive supporting projects that drive STEM learning, climate action, biodiversity conservation, and community renewables.
7 - AFFORDABLE AND CLEAN ENERGY
7.1, 7.2 & 7.3 - By 2030, ensure universal access to affordable, reliable and modern energy services, increase the share of renewable energy in the global energy mix, and increase the global rate of energy efficiency 7.a - Cooperation with regards to research and investment in clean energy infrastructure and technology
Provided renewable energy to the grid and provided renewable investment opportunities.
8 - DECENT WORK AND ECONOMIC GROWTH
8.5 - Provide full and productive employment and decent work for all
Extensive Health and Safety measure ensures employees are not exposed to risk. Supply chain analysis and strengthened policies to ensure labour rights are upheld across ORIT's suppliers.
10 - REDUCED INEQUALITIES
10.2 - By 2030, empower and promote the social, economic and political inclusion of all, irrespective of age, sex, disability, race, ethnicity, origin, religion or economic or other status
ORIT promotes inclusion through core business practices and by providing financial support to other initiatives such as the Generation UK's programmes, which reduce barriers to employment by delivering highquality skills bootcamps that equip individuals with the skills needed to access meaningful, sustainable careers.
13 - CLIMATE ACTION
13.1 - Strengthen resilience and adaptive capacity to climate related hazards and natural disasters.
13.3 - Improve education, awareness-raising and human and institutional capacity on climate change mitigation, adaptation, impact reduction and early warning
Biodiversity and habitat management plans proposed for most sites as planning requirement. Physical climate change risks considered and mitigated (e.g. flood risk mitigation strategy) and transition risks forecasted (e.g. low power price scenarios). Participation in working groups to improve climate risk assessment and disclosure. Through many of its initiatives, ORIT strives to increase education and awareness related to climate change and impact reduction.
15 - LIFE ON LAND
15.5 - Take urgent and significant action to reduce the degradation of natural habitats, halt the loss of biodiversity and, by 2020, protect and prevent the extinction of threatened species
Threatened and non-threatened species monitored through ecological surveys and biodiversity plans. Additional biodiversity initiatives implemented beyond planning requirement.
Interim Management Report
The Directors are required to provide an Interim Management Report in accordance with the Financial Conduct Authority ("FCA") Disclosure Guidance and Transparency Rules ("DTR"). The Chair's Statement and the Investment Manager's Report in this interim report provide details of the important events which have occurred during the period and their impact on the financial statements. The following statements on principal risks and uncertainties, related party transactions, going concern and the Directors' Responsibility Statement below, together constitute the Interim Management Report for the Company for the six months ended 30 June 2026. The outlook for the Company for the remaining six months of the year ending 31 December 2026 is discussed in the Chair's Statement and the Investment Manager's Report.
Risk Appetite and Risk Management
The Board is responsible for overseeing the Company's risk management framework and reviews the principal and emerging risks facing the Company on an ongoing basis. The Investment Manager maintains the risk register and reports to the Board at least quarterly. Risks are assessed using a consistent methodology that considers both likelihood and impact, with the Board reviewing changes in the external environment, portfolio developments and the effectiveness of mitigating actions.
The Company's overall risk management framework and detailed principal risk disclosures are set out in the 2025 Annual Report.
During the period the Board continued to embed the enhanced risk management framework introduced in the 2025 Annual Report. No changes have been made to the overall framework or principal risk categories, although the assessment of certain risks has been updated to reflect developments during the period.
During the first half of 2026 the Board's principal areas of focus included:
· increased political and regulatory uncertainty affecting renewable energy markets;
· continued monitoring of electricity market reform and subsidy developments;
· developer execution risk, including planning, permitting and grid connection timelines;
· balance sheet management, dividend sustainability and liquidity; and
· ongoing monitoring of merchant revenue exposure, particularly in Finland.
|
Principal risk |
Direction |
H1 2026 developments |
|
Share price and market sentiment |
= |
Share price discount remains elevated, with investor focus continuing to centre on discount management, dividend sustainability, leverage and execution of the ORIT 2030 strategy. |
|
Asset valuation |
↓ |
During the period the Board completed a comprehensive review of long-term energy yield assumptions across the operational onshore wind portfolio, incorporating updated post-construction operating data and independent technical evidence where appropriate. While valuation assumptions remain subject to ongoing market movements, including power prices and discount rates, the review has reduced uncertainty associated with long-term yield assumptions. The Board continues to maintain a strong focus on valuation assumptions and the appropriateness of key inputs used in the independent valuation process. |
|
Power markets |
= |
The Board has continued to monitor wholesale electricity market volatility, particularly following heightened geopolitical tensions in Ukraine and the Middle East, together with developments in merchant pricing and UK electricity market reform. |
|
Gearing and financing |
= |
Continued focus on covenant headroom, liquidity and dividend sustainability. The Group remained compliant with all financing covenants during the period. |
|
Asset and operational risk |
= |
Operational performance remained broadly stable, with active asset management continuing to mitigate operational risks across the portfolio. |
|
Cybersecurity & IT |
= |
No material change. Cybersecurity continues to be monitored closely given the evolving external threat environment. |
|
Environmental, social and governance ("ESG") |
= |
No material change. The Company continues to monitor evolving ESG regulation and climate-related risks across the portfolio. No material ESG incidents or breaches during the period. The Board continued to operate in accordance with its governance framework, providing oversight of the Company's strategy, risk management and system of internal controls. |
|
Construction and development |
↑ |
Continued planning, permitting and grid connection delays have led to extended development timelines at certain platforms, increasing execution risk across parts of the development portfolio. |
|
Regulation and policy |
= |
Continued monitoring of UK and European electricity market reform, including voluntary CfDs and broader regulatory developments affecting renewable energy infrastructure. Political debate surrounding energy policy continues to contribute to regulatory uncertainty. |
|
Geopolitical risk |
= |
The Board has continued to monitor the conflicts in Ukraine and the Middle East, recognising their potential impact on energy markets, commodity prices, inflation and investor sentiment, although no direct operational impacts have been experienced. |
↑ Increase to risk rating = No change ↓ Decrease to risk rating
The experience of the Company's Investment Manager and the diversification of the Company's portfolio continue to be the key mitigants for these risks. The Company's ESG & Impact Report, published in the 2025 Annual Report and Accounts on 24 March 2026, details examples of specific projects that the Investment Manager has undertaken to mitigate some of these risks in the period.
Task Force on Climate-related Financial Disclosures ("TCFD")
The Financial Conduct Authority ("FCA") issued a rule, effective for periods beginning on or after January 2021, for UK listed companies to start to report against the TCFD, with other companies to follow. Whilst not currently mandated to make a TCFD disclosure, as investment trusts are currently excluded from the requirement, ORIT supports the TCFD's aims and objectives and voluntarily reports in line with the rule to help ensure best practice disclosures. Material climate-related financial disclosures can help support investment decisions as we move towards a low-carbon economy. The Company is acutely aware of the risks of climate change and through its investment mandate, believes it is well placed to contribute to solutions and harness the opportunities that arise from a transition to net zero. However, no company is isolated from climate change, and the disclosures below outline the climate-related risks ORIT faces.
Our TCFD approach is detailed on page 37 of the 2025 Annual Report with a full version available on the ORIT website here. The Company is pleased to confirm that it has included climate-related financial disclosures aligned with the four recommendations and the eleven recommended disclosures provided in the TCFD's 2021 report 'Implementing the Recommendations of the Task Force on Climate-related Financial Disclosures', which included additional guidance for Asset Owners and Asset Managers.
Related Party Transactions
The Company's AIFM is considered a related party under the Listing Rules. Under the terms of the Management Agreement, the AIFM is entitled to a management fee calculated by applying a rate of 0.95% per annum up to £500 million and 0.85% per annum in excess of £500 million to the average of (i) the Company's average daily closing market capitalisation during the relevant quarter and (ii) the published Net Asset Value ("NAV") for that quarter. The fee is payable quarterly in arrears and is capped at the lower of (a) the amount calculated under this methodology and (b) the amount that would have been payable based solely on NAV.
No performance fee or asset-level fees are payable to the AIFM under the Management Agreement. The AIFM is responsible for paying the fees of the Investment Manager.
Details of the amounts paid to the Company's AIFM during the period are disclosed in the Statement of Comprehensive Income within the Interim Financial Statements.
Going Concern
The Directors have reviewed comprehensive cash flow forecasts prepared by the Company's Investment Manager which are based on prudent market data and believe, based on these forecasts, that it is appropriate to prepare the financial statements of the Company on a going concern basis. The Directors have assessed the Company's ability to continue as a going concern for a period of at least 12 months from the date of approval of this interim report.
In arriving at their conclusion that the Company has adequate financial resources to continue in operational existence for the foreseeable future, the Directors were mindful that the Company had unrestricted cash of £10.6 million as at 30 June 2026 and available headroom on its RCF of £95.0 million. The Company's net assets as at 30 June 2026 were £455 million and total expenses for the period were £2.5 million, which, when annualised, represented approximately 1.13% of average net assets during the period. At the date of approval of this document, based on the aggregate of investments and cash held, the Company has substantial operating expenses cover.
The Company receives revenue in the form of dividends and interest from its portfolio of assets. These revenues are derived from the sale of electricity through power purchase agreements in place with large and reputable providers of electricity to the market. A prolonged and deep market decline could lead to falling values of the underlying business or interruptions to cash flow, however the Directors do not foresee any immediate material risk to the Company's investment portfolio and income from underlying assets. The Directors are also satisfied and are comfortable that the Company would continue to remain viable under downside scenarios, including decreasing government regulated tariffs and a decline in long-term power price forecasts.
In instances where underlying investments have external debt finance, the covenants associated with these facilities have been tested and are expected to be compliant, even in downside scenarios.
The major cash outflows of the Company are the payment of dividends, commitments payable for construction projects and contingent acquisitions. The covenants of the RCF have been tested and are expected to be compliant, even in downside scenarios. Plausible downside scenarios include a decrease in wholesale energy prices, a decrease in output and an increase in the discount rate applied to the underlying cash flow forecasts. While in some downside scenarios, the headroom available on the RCF will be lower, the Directors remain confident that the Company has sufficient cash balances, and headroom in the RCF held by an intermediate holding company in order to fund the commitments detailed in note 13 to the financial statements, should they become payable.
The Directors have concluded that the financial statements of the Company should be prepared on a going concern basis.
Responsibility Statement of the Directors
The Directors acknowledge responsibility for the interim results and approve this Interim Report. The Directors confirm that to the best of their knowledge:
a) the condensed financial statements have been prepared in accordance with IAS 34 "Interim Financial Reporting", as contained in UK-adopted international accounting standards, and give a true and fair view of the assets, liabilities and financial position and the profit of the Company as required by the FCA's Disclosure Guidance and Transparency Rules. DTR 4.2.4R;
b) the interim management report, included within the Chair's Statement and Investment Manager's Report, includes a fair review of the information required by DTR 4.2.7R and DTR 4.2.8R.
This responsibility statement has been approved by the Board.
Philip Austin MBE
Chair
22 September 2026
Financial Statements
Condensed Statement of Comprehensive Income
For the six months ended 30 June 2026 (unaudited)
|
|
|
(Unaudited) |
(Unaudited) |
(Audited) |
||||||
|
|
|
For the six months ended |
For the six months ended |
For the year ended |
||||||
|
|
|
30 June 2026 |
30 June 2025 |
31 December 2025 |
||||||
|
|
|
Revenue |
Capital |
Total |
Revenue |
Capital |
Total |
Revenue |
Capital |
Total |
|
|
Notes |
£'000 |
£'000 |
£'000 |
£'000 |
£'000 |
£'000 |
£'000 |
£'000 |
£'000 |
|
Losses on investments |
- |
(38,011) |
(38,011) |
- |
(23,715) |
(23,715) |
- |
(59,537) |
(59,537) |
|
|
Income from investments |
3 |
16,667 |
- |
16,667 |
22,478 |
- |
22,478 |
42,842 |
- |
42,842 |
|
Gross profit/(loss) |
16,667 |
(38,011) |
(21,344) |
22,478 |
(23,715) |
(1,237) |
42,842 |
(59,537) |
(16,695) |
|
|
Investment management fees |
(1,385) |
(462) |
(1,847) |
(1,926) |
(642) |
(2,568) |
(3,638) |
(1,213) |
(4,851) |
|
|
Other expenses |
(661) |
- |
(661) |
(793) |
- |
(793) |
(1,608) |
- |
(1,608) |
|
|
Net finance income |
90 |
- |
90 |
120 |
- |
120 |
203 |
- |
203 |
|
|
Profit/(loss) before taxation |
|
14,711 |
(38,473) |
(23,762) |
19,879 |
(24,357) |
(4,478) |
37,799 |
(60,750) |
(22,951) |
|
Taxation |
4 |
- |
- |
- |
- |
- |
- |
(304) |
304 |
- |
|
Profit/(loss) after taxation |
|
14,711 |
(38,473) |
(23,762) |
19,879 |
(24,357) |
(4,478) |
37,495 |
(60,446) |
(22,951) |
|
Earnings/(losses) per share |
5 |
2.79p |
(7.29)p |
(4.50)p |
3.61p |
(4.42)p |
(0.81)p |
6.92p |
(11.15)p |
(4.23)p |
The "Total" column of this statement is the profit and loss account of the Company. The "Revenue" and "Capital" columns represent supplementary information prepared under guidance issued by The Association of Investment Companies. The Company has no other items of other comprehensive income, and therefore the net profit/(loss) after taxation is also the total comprehensive income/ (loss) for the period. All revenue and capital items in the above statement derive from continuing operations. No operations were acquired or discontinued in the period.
Condensed Statement of Financial Position
at 30 June 2026 (unaudited)
|
|
|
(Unaudited) |
(Unaudited) |
(Audited) |
|
|
|
30 June 2026 |
30 June 2025 |
31 December 2025 |
|
|
Notes |
£'000 |
£'000 |
£'000 |
|
Fixed assets |
||||
|
Investments at fair value through profit or loss |
7,11 |
445,198 |
532,318 |
485,430 |
|
Current assets |
||||
|
Other debtors |
8 |
73 |
10,049 |
92 |
|
Cash and cash equivalents |
10,644 |
176 |
10,775 |
|
|
10,717 |
10,225 |
10,867 |
||
|
Creditors: amounts falling due within one year |
||||
|
Other creditors and accruals |
(1,231) |
(2,110) |
(1,497) |
|
|
Net current assets |
9,486 |
8,115 |
9,370 |
|
|
Total assets less current liabilities |
454,684 |
540,433 |
494,800 |
|
|
Net assets |
454,684 |
540,433 |
494,800 |
|
|
Capital and reserves |
||||
|
Share capital |
9 |
5,649 |
5,649 |
5,649 |
|
Share premium |
217,283 |
217,283 |
217,283 |
|
|
Special reserve |
313,222 |
323,978 |
313,222 |
|
|
Capital reserve |
(110,219) |
(35,657) |
(71,746) |
|
|
Revenue reserve |
28,749 |
29,180 |
30,392 |
|
|
Total equity shareholders' funds |
454,684 |
540,433 |
494,800 |
|
|
Net asset value per share |
10 |
86.18p |
99.46p |
93.79p |
Condensed Statement of Changes in Equity
Six months ended 30 June 2026 (unaudited)
|
|
|
Share |
Share |
Special |
Capital |
Revenue |
|
|
|
|
capital |
premium |
reserve |
reserve |
reserve |
Total |
|
|
Notes |
£'000 |
£'000 |
£'000 |
£'000 |
£'000 |
£'000 |
|
At 31 December 2025 |
5,649 |
217,283 |
313,222 |
(71,746) |
30,392 |
494,800 |
|
|
(Loss)/profit for the period |
- |
- |
- |
(38,473) |
14,711 |
(23,762) |
|
|
Dividends paid in the period |
6 |
- |
- |
- |
- |
(16,354) |
(16,354) |
|
At 30 June 2026 |
5,649 |
217,283 |
313,222 |
(110,219) |
28,749 |
454,684 |
Six months ended 30 June 2025 (unaudited)
|
|
|
Share |
Share |
Special |
Capital |
Revenue |
|
|
|
|
capital |
premium |
reserve |
reserve |
reserve |
Total |
|
|
Notes |
£'000 |
£'000 |
£'000 |
£'000 |
£'000 |
£'000 |
|
At 31 December 2024 |
5,649 |
217,283 |
332,590 |
(11,300) |
26,148 |
570,370 |
|
|
Repurchase of the Company's own shares into treasury |
- |
- |
(8,542) |
- |
- |
(8,542) |
|
|
Cost of share repurchases |
- |
- |
(70) |
- |
- |
(70) |
|
|
(Loss)/profit for the period |
- |
- |
- |
(24,357) |
19,879 |
(4,478) |
|
|
Dividends paid in the period |
6 |
- |
- |
- |
- |
(16,847) |
(16,847) |
|
At 30 June 2025 |
5,649 |
217,283 |
323,978 |
(35,657) |
29,180 |
540,433 |
Year ended 31 December 2025 (audited)
|
|
|
Share |
Share |
Special |
Capital |
Revenue |
|
|
|
|
capital |
premium |
reserve |
reserve |
reserve |
Total |
|
|
Notes |
£'000 |
£'000 |
£'000 |
£'000 |
£'000 |
£'000 |
|
At 31 December 2024 |
5,649 |
217,283 |
332,590 |
(11,300) |
26,148 |
570,370 |
|
|
Repurchase of the Company's own shares into treasury |
- |
- |
(19,201) |
- |
- |
(19,201) |
|
|
Cost of share repurchases |
- |
- |
(167) |
- |
- |
(167) |
|
|
(Loss)/profit for the year |
- |
- |
- |
(60,446) |
37,495 |
(22,951) |
|
|
Dividends paid in the year |
6 |
- |
- |
- |
- |
(33,251) |
(33,251) |
|
At 31 December 2025 |
5,649 |
217,283 |
313,222 |
(71,746) |
30,392 |
494,800 |
Condensed Statement of Cash Flows
For the six months ended 30 June 2026 (unaudited)
|
|
|
(Unaudited) |
(Unaudited) |
(Audited) |
|
|
|
Six months |
Six months |
Year ended |
|
|
|
ended |
ended |
31 December |
|
|
|
30 June 2026 |
30 June 2025 |
2025 |
|
|
Notes |
£'000 |
£'000 |
£'000 |
|
Operating activities |
||||
|
Loss before taxation |
(23,762) |
(4,478) |
(22,951) |
|
|
Movement in fair value of investments |
7 |
38,011 |
23,715 |
59,537 |
|
Income from investments |
3 |
(16,667) |
(22,478) |
(42,842) |
|
Increase/(decrease) in other debtors |
19 |
(10,026) |
(69) |
|
|
Decrease in other creditors |
(266) |
(691) |
(1,304) |
|
|
Dividends received from investments |
4,500 |
10,000 |
18,000 |
|
|
Interest received from investments |
10,946 |
12,478 |
22,874 |
|
|
Net cash inflow from operating activities |
12,781 |
8,520 |
33,245 |
|
|
Investing activities |
||||
|
Costs associated with acquiring the portfolio of assets |
7 |
- |
(338) |
(357) |
|
Repayment of debt principal |
3,442 |
5,601 |
18,654 |
|
|
Net cash inflow from investing |
3,442 |
5,263 |
18,297 |
|
|
Financing activities |
||||
|
Dividends paid |
6 |
(16,354) |
(16,847) |
(33,251) |
|
Shares bought back and held in treasury |
9 |
- |
(8,542) |
(19,201) |
|
Costs of share buybacks |
- |
(70) |
(167) |
|
|
Net cash outflow from financing |
(16,354) |
(25,459) |
(52,619) |
|
|
Decrease in cash |
(131) |
(11,676) |
(1,077) |
|
|
Cash and cash equivalents at start of period |
10,775 |
11,852 |
11,852 |
|
|
Cash and cash equivalents at end of period |
10,644 |
176 |
10,775 |
Notes to the Condensed Interim Financial Statements
For the period ended 30 June 2026
1. Financial statements
The information contained within the financial statements in this half year report has not been audited or reviewed by the Company's independent auditor.
The figures and financial information for the year ended 31 December 2025 are extracted from the latest published financial statements of the Company and do not constitute statutory financial statements for that year. Those financial statements have been delivered to the Registrar of Companies and included the report of the auditor which was unqualified and did not contain a statement under either section 498(2) or 498(3) of the Companies Act 2006.
This half year report will be made available to the public at the registered office of the Company. The report will be available in electronic format on the Company's website (https://octopusrenewablesinfrastructure.com).
2. Accounting policies
(a) Basis of preparation
The financial statements have been prepared in accordance with International Accounting Standard 34 "Interim Financial Reporting", as contained in UK-adopted international accounting standards, and the accounting policies set out in the statutory accounts of the Company for the year ended 31 December 2025. Where presentational guidance set out in the Statement of Recommended Practice (the "SORP") for investment trusts issued by the Association of Investment Companies in December 2025, is consistent with the requirements of International Financial Reporting Standards, the financial statements have been prepared on a basis compliant with the recommendations of the SORP.
(b) Basis of non-consolidation
The Company has one wholly owned direct subsidiary, ORIT Holdings II Limited, whose purpose is to invest the funds of ORIT. The Company and its subsidiary both meet the requirements to be classified as an investment entity as defined in International Financial Reporting Standard 10 "Consolidated Financial Statements". Consequently, the Company measures its subsidiary at fair value through profit or loss and does not prepare consolidated financial statements.
(c) Fair value calculations
The underlying investments are valued by the investment manager, using discounted cash flow techniques. The policy on valuation of investments is consistent with that detailed in note 3 to the financial statements for the year ended 31 December 2025, presented on page 94 of the annual report and note 10 on pages 101 and 102 of the annual report.
(d) Accounting estimates
In common with many other investment companies, the Board has chosen to adopt the 'allocation approach', as set out in the SORP, and has determined that the basis of allocation of certain expenses to capital should reflect the Directors' estimate of the future long-term split of returns in the form of capital gains and income. Accordingly, the Company allocates 25% of the management fee and 25% of any finance costs to capital and the remaining 75% to revenue. The Board monitors the assumptions that underpin the basis of allocation.
3. Income
|
|
Six months ended |
Six months ended |
Year ended |
|
|
30 Jun 2026 |
30 Jun 2025 |
31 Dec 2025 |
|
|
(unaudited) |
(unaudited) |
(audited) |
|
|
£'000 |
£'000 |
£'000 |
|
Dividends |
4,500 |
10,000 |
18,000 |
|
Investment interest income |
12,167 |
12,478 |
24,842 |
|
Income from investments |
16,667 |
22,478 |
42,842 |
4. Taxation
The Company's effective corporation tax rate is nil, as deductible expenses and interest distributions exceed taxable income. Any tax relief obtained on expenses allocated to capital is credited to the capital account in accordance with the requirements of the SORP.
5. Earnings/(losses) per share
|
|
Six months ended |
Six months ended |
Year ended |
|
|
30 Jun 2026 |
30 Jun 2025 |
31 Dec 2025 |
|
|
(unaudited) |
(unaudited) |
(audited) |
|
Revenue profit after taxation (£'000) |
14,711 |
19,879 |
37,495 |
|
Capital loss after taxation (£'000) |
(38,473) |
(24,357) |
(60,446) |
|
Total loss after tax (£'000) |
(23,762) |
(4,478) |
(22,951) |
|
Weighted average number of shares in issue during the period |
527,576,939 |
550,764,715 |
541,981,848 |
|
Revenue earnings per share |
2.79p |
3.61p |
6.92p |
|
Capital losses per share |
(7.29)p |
(4.42)p |
(11.15)p |
|
Total losses per share |
(4.50)p |
(0.81)p |
(4.23)p |
There are no diluted returns per share as there are no dilutive or potentially dilutive instruments in issue.
6. Dividends paid
|
|
Six months ended |
Six months ended |
Year ended |
|
|
30 Jun 2026 |
30 Jun 2025 |
31 Dec 2025 |
|
|
(unaudited) |
(unaudited) |
(audited) |
|
|
£'000 |
£'000 |
£'000 |
|
Q4 2025 dividend paid of 1.55p (2024: 1.51p) |
8,177 |
8,380 |
8,380 |
|
Q1 2026 dividend paid of 1.55p (2025: 1.54p) |
8,177 |
8,467 |
8,467 |
|
Q2 2025 dividend paid of 1.54p |
- |
- |
8,280 |
|
Q3 2025 dividend paid of 1.54p |
- |
- |
8,124 |
|
16,354 |
16,847 |
33,251 |
An interim dividend of 1.56p (2025: 1.54p) per share, amounting to £8,230,000 (2025: £8,280,000), has been declared payable in respect of Q2 2026. This dividend was paid on 1 September 2026 to shareholders on the register on 14 August 2026.
7. Investments at fair value through profit or loss
(a) Changes in the valuation of the Company's direct holding in its subsidiary, ORIT Holdings II Limited ("the subsidiary")
|
|
Six months ended |
Six months ended |
Year ended |
|
|
30 Jun 2026 |
30 Jun 2025 |
31 Dec 2025 |
|
|
(unaudited) |
(unaudited) |
(audited) |
|
|
£'000 |
£'000 |
£'000 |
|
Opening balance of the subsidiary at fair value |
485,430 |
561,296 |
561,296 |
|
Additional investment in the intermediate holding companies |
- |
338 |
357 |
|
Distributions received |
(18,888) |
(28,079) |
(59,528) |
|
Investment income |
16,667 |
22,478 |
42,842 |
|
Movement in fair value |
(38,011) |
(23,715) |
(59,537) |
|
Closing balance of the subsidiary at fair value |
445,198 |
532,318 |
485,430 |
(b) Reconciliation of movement in the fair value of the Company's underlying portfolio of investments
|
|
Six months ended |
Six months ended |
Year ended |
|
|
30 Jun 2026 |
30 Jun 2025 |
31 Dec 2025 |
|
|
(unaudited) |
(unaudited) |
(audited) |
|
|
£'000 |
£'000 |
£'000 |
|
Opening balance |
603,195 |
699,604 |
699,604 |
|
Purchases of investments |
15,445 |
8,901 |
18,521 |
|
Sales of investments |
- |
- |
(70,385) |
|
Distributions received from investments |
(23,370) |
(27,029) |
(57,326) |
|
Movement in fair value of investments |
(21,865) |
11,588 |
12,781 |
|
Fair value of the underlying portfolio of investments at the end of the period |
573,405 |
693,064 |
603,195 |
|
Cash held in the intermediate holding companies |
2,522 |
15,333 |
1,781 |
|
Bank loan drawn down by the intermediate holding companies |
(131,368) |
(168,365) |
(116,198) |
|
Fair value of other net assets and (liabilities) held by the intermediate holding companies |
639 |
(7,714) |
(3,348) |
|
Fair value of the Company's investments at the end of the period |
445,198 |
532,318 |
485,430 |
8. Other debtors
|
|
30 Jun 2026 |
30 Jun 2025 |
31 Dec 2025 |
|
|
(unaudited) |
(unaudited) |
(audited) |
|
|
£'000 |
£'000 |
£'000 |
|
Dividend receivable from subsidiary |
- |
10,000 |
- |
|
Other prepayments and receivables |
73 |
49 |
92 |
|
73 |
10,049 |
92 |
9. Share capital
Changes in called-up share capital during the period were as follows:
|
|
Six months ended |
Six months ended |
Year ended |
|
|
30 Jun 2026 |
30 Jun 2025 |
31 Dec 2025 |
|
|
(unaudited) |
(unaudited) |
(audited) |
|
|
£'000 |
£'000 |
£'000 |
|
Ordinary shares of 1p each, allotted, called‑up and fully paid |
|||
|
Opening balance of shares of 1p each, excluding shares held in treasury |
5,276 |
5,557 |
5,557 |
|
Repurchase of shares into treasury |
- |
(123) |
(281) |
|
Subtotal of shares of 1p each, excluding shares held in treasury |
5,276 |
5,434 |
5,276 |
|
Shares held in treasury |
373 |
215 |
373 |
|
Closing balance of shares of 1p each, including shares held in treasury |
5,649 |
5,649 |
5,649 |
Changes in the numbers of shares in issue during the period were as follows:
|
|
Six months ended |
Six months ended |
Year ended |
|
|
30 Jun 2026 |
30 Jun 2025 |
31 Dec 2025 |
|
|
(unaudited) |
(unaudited) |
(audited) |
|
Opening balance of shares in issue, excluding shares held in treasury |
527,576,939 |
555,658,774 |
555,658,774 |
|
Repurchase of shares into treasury |
- |
(12,288,206) |
(28,081,835) |
|
Closing balance of shares in issue, excluding shares held in treasury |
527,576,939 |
543,370,568 |
527,576,939 |
|
Closing balance of shares held in treasury |
37,350,597 |
21,556,968 |
37,350,597 |
|
Closing balance of shares in issue, including shares held in treasury |
564,927,536 |
564,927,536 |
564,927,536 |
10. Net asset value ("NAV") per share
|
|
30 Jun 2026 |
30 Jun 2025 |
31 Dec 2025 |
|
|
(unaudited) |
(unaudited) |
(audited) |
|
NAV (£'000) |
454,684 |
540,433 |
494,800 |
|
Closing balance of shares in issue, excluding shares held in treasury |
527,576,939 |
543,370,568 |
527,576,939 |
|
NAV per share |
86.18p |
99.46p |
93.79p |
11. Financial Instruments measured at fair value
The Company's financial instruments that are held at fair value comprise its investment portfolio. The recognition and measurement policies for financial instruments measured at fair value have not changed from those set out in the statutory accounts of the Company for the year ended 31 December 2025.
IFRS 13 requires that financial instruments held at fair value are categorised into a hierarchy comprising the following three levels:
Level 1 - valued using quoted prices in active markets.
Level 2 - valued by reference to valuation techniques using observable inputs other than quoted market prices included within Level 1.
Level 3 - valued by reference to valuation techniques using inputs that are not based on observable market data.
Categorisation within the hierarchy has been determined on the basis of the lowest level input that is significant to the fair value measurement of the relevant asset.
At 30 June 2026, the Company's investment portfolio was categorised as follows:
|
|
30 Jun 2026 |
30 Jun 2025 |
31 Dec 2025 |
|
|
(unaudited) |
(unaudited) |
(audited) |
|
|
£'000 |
£'000 |
£'000 |
|
Level 1 |
- |
- |
- |
|
Level 2 |
14,096 |
14,505 |
12,491 |
|
Level 3 |
431,102 |
517,813 |
472,939 |
|
Total |
445,198 |
532,318 |
485,430 |
There have been no transfers between Levels 1, 2 or 3 during the period (period ended 30 June 2025: nil and year ended 31 December 2025: nil).
12. Post period end events
On 3 August 2026, the Company declared an interim dividend in respect of the period from 1 April 2026 to 30 June 2026 of 1.56 pence per Ordinary Share, paid on 1 September 2026 to Shareholders on the register at 14 August 2026. On that record date, the number of Ordinary Shares in issue was 527,576,939 and the total dividend paid to Shareholders amounted to £8.2 million. The dividend has not been included as a liability at 30 June 2026.
13. Guarantees and uncalled capital commitments
The Company guarantees the foreign exchange hedges entered into by its intermediate holding companies to enable it to minimise its exposure to changes in underlying foreign exchange rates. As at 30 June 2026, the Company has guarantees in respect of future investment obligations associated with a conditional acquisition in Ireland of £23.3 million (€27.1 million) (2025: £23.7 million / €27.1 million).
Alternative Performance Measures ("APMs")
The financial measures below are classified as APMs as defined by the European Securities and Markets Authority. Under this definition, APMs include a financial measure of historical performance or financial position, other than a financial measure defined or specified in the applicable financial reporting framework. These measures are commonly used by investment companies to assess values, investment performance and operating costs. Numerical calculations are given where appropriate.
Performance of the Company's underlying operational investments
|
|
Output |
Revenue |
Opex |
EBITDA |
|
Operational portfolio |
30 June 2026: |
30 June 2026: |
30 June 2026: |
30 June 2026: |
|
614 GWh |
£67.2 million |
£25.1 million |
£42.1 million |
|
|
(30 June 2025: |
(30 June 2025: |
(30 June 2025: |
(30 June 2025: |
|
|
654GWh) |
£68.7 million) |
£24.4 million) |
£44.3 million) |
|
|
Solar |
30 June 2026: |
30 June 2026: |
30 June 2026: |
30 June 2026: |
|
271 GWh |
£30.2 million |
£7.9 million |
£22.3 million |
|
|
(30 June 2025: |
(30 June 2025: |
(30 June 2025: |
(30 June 2025: |
|
|
294GWh) |
£33.1 million) |
£7.8 million) |
£25.3 million) |
|
|
Onshore wind |
30 June 2026: |
30 June 2026: |
30 June 2026: |
30 June 2026: |
|
263 GWh |
£13.4 million |
£4.9 million |
£8.5 million |
|
|
(30 June 2025: |
(30 June 2025: |
(30 June 2025: |
(30 June 2025: |
|
|
291GWh) |
£16.7 million) |
£4.8 million) |
£11.9 million) |
|
|
Offshore wind |
30 June 2026: |
30 June 2026: |
30 June 2026: |
30 June 2026: |
|
80 GWh |
£23.6 million |
£12.3 million |
£11.3 million |
|
|
(30 June 2025: |
(30 June 2025: |
(30 June 2025: |
(30 June 2025: |
|
|
68GWh) |
£18.9 million) |
£11.8 million) |
£7.1 million) |
Discount
The amount by which the share price of an investment trust is lower (discount) or higher (premium) than the NAV per share. The discount or premium is expressed as a percentage of the NAV per share. If the shares are trading at a discount, investors would be paying less than the value attributable to the shares as calculated in accordance with generally accepted accounting practice. The discount at the period end was as follows:
|
|
|
30 Jun 2026 |
30 Jun 2025 |
31 Dec 2025 |
|
NAV per share |
a |
86.18p |
99.46p |
93.79p |
|
Share price |
b |
65.90p |
73.40p |
61.10p |
|
Discount |
(b/a)-1 |
(23.5%) |
(26.2%) |
(34.9%) |
Gross asset value ("GAV")
The Company's gross assets comprise the Company's NAV plus the total debt held in (unconsolidated) subsidiaries.
|
|
|
30 Jun 2026 |
30 Jun 2025 |
31 Dec 2025 |
|
|
|
£m |
£m |
£m |
|
NAV |
a |
454.7 |
540.4 |
494.8 |
|
Total debt |
b |
396.8 |
469.9 |
402.1 |
|
GAV |
a+b |
851.5 |
1,010.3 |
896.9 |
Leverage
Total leverage represents total debt in the table above, expressed as a percentage of GAV.
Dividend yield
Dividend yield represents the target annual dividend for the year, expressed as a percentage of the share price at 30 June 2026.
|
|
|
30 Jun 2026 |
30 Jun 2025 |
31 Dec 2025 |
|
Target annual dividend |
a |
6.23p |
6.17p |
6.17p |
|
Share price |
b |
65.90p |
73.40p |
61.10p |
|
Dividend yield |
a/b |
9.5% |
8.4% |
10.1% |
Ongoing charges ratio ("OCR")
The OCR is calculated in accordance with The Association of Investment Companies' recommended methodology and represents the annualised management fee and all other recurring operating expenses excluding any finance costs and transaction costs, expressed as a percentage of the average net asset values during the period.
|
|
|
Six months |
Six months |
|
|
|
|
ended |
ended |
Year ended |
|
|
|
30 Jun 2026 |
30 Jun 2025 |
31 Dec 2025 |
|
Annualised expenses (£'000) |
a |
5,230 |
6,834 |
6,459 |
|
Average NAV (£,000) |
b |
463,878 |
545,445 |
529,772 |
|
Ongoing charges Ratio ("OCR") |
a/b |
1.13% |
1.25% |
1.22% |
Total return
Total return is the combined effect of any dividends paid, together with the rise or fall in the NAV per share or share price. Total return statistics enable the investor to make performance comparisons between investment companies with different dividend policies. Any dividends received by a shareholder are assumed to have been reinvested in either the assets of the Company at its NAV per share at the time the shares were quoted ex-dividend (to calculate the NAV per share total return) or in additional shares of the Company (to calculate the share price total return).
Total returns for the six months ended 30 June 2026 are calculated as follows:
|
|
|
|
NAV |
|
|
|
Share price |
per share |
|
Value at 31 December 2025 |
a |
61.10p |
93.79p |
|
Dividends paid from IPO to 31 December 2025 |
b |
29.85p |
29.85p |
|
Value plus dividends paid to 31 December 2025 |
a+b=c |
90.95p |
123.64p |
|
Value at 30 June 2026 |
d |
65.90p |
86.18p |
|
Benefit of reinvesting dividends |
e |
4.55p |
(1.66)p |
|
Dividends paid in the six months ended 30 June 2026 |
f |
3.10p |
3.10p |
|
Total returns for the six months ended 30 June 2026 |
[(b+d+e+f)/c]-1 |
13.7% |
(5.0)% |
|
Annualised total return |
29.5% |
(9.8)% |
Total returns from IPO to 30 June 2026 are calculated as follows:
|
|
|
|
NAV |
|
|
|
Share price |
per share |
|
Value at IPO (10 December 2019) |
a |
100.00p |
98.00p |
|
Value at 30 June 2026 |
b |
65.90p |
86.18p |
|
Benefit of reinvesting dividends |
c |
(1.08)p |
0.11p |
|
Dividends paid from IPO to 30 June 2026 |
d |
32.95p |
32.95p |
|
Total returns from IPO to 30 June 2026 |
[(b+c+d)/a]-1 |
(2.2)% |
21.7% |
|
Annualised total return |
(0.3)% |
3.0% |
Dividend cover
Dividend cover is calculated using net operational cash flows from the portfolio after debt service and company and intermediate holding company expenses, as follows:
|
|
Six months ended |
Six months ended |
Year ended |
|
|
30 Jun 2026 |
30 Jun 2025 |
31 Dec 2025 |
|
Net operational cash flows (£m) |
22.6 |
20.0 |
37.7 |
|
Dividends declared (£m) |
16.4 |
16.8 |
33.0 |
|
Dividend cover |
1.38X |
1.19X |
1.14X |
NB: Page number references in this announcement refer to pages in the Company's simultaneously published Interim Report and Accounts.
This information is provided by RNS, the news service of the London Stock Exchange. RNS is approved by the Financial Conduct Authority to act as a Primary Information Provider in the United Kingdom. Terms and conditions relating to the use and distribution of this information may apply. For further information, please contact rns@lseg.com or visit www.rns.com.
RNS may use your IP address to confirm compliance with the terms and conditions, to analyse how you engage with the information contained in this communication, and to share such analysis on an anonymised basis with others as part of our commercial services. For further information about how RNS and the London Stock Exchange use the personal data you provide us, please see our Privacy Policy.
ENDRNS may use your IP address to confirm compliance with the terms and conditions, to analyse how you engage with the information contained in this communication, and to share such analysis on an anonymised basis with others as part of our commercial services. For further information about how RNS and the London Stock Exchange use the personal data you provide us, please see our Privacy Policy.