

Montanaro European Smaller C.TstPLC
22 July 2026
Montanaro European Smaller Companies Trust PLC
213800CWSC5B8BG3RS21
Final Results
2026 Annual Results and Notice of Annual General Meeting
Montanaro European Smaller Companies Trust plc announces its annual results for the year ended 31 March 2026 and the publication of its annual report and accounts for the same period, which includes the notice of its 2026 annual general meeting.
HIGHLIGHTS
for the year ended 31 March 2026
Performance
|
Total return % |
1 year |
3 year |
5 year |
10 year |
MAM* |
|
Net Asset Value ("NAV") per share( 1) |
1.8% |
5.6% |
6.4% |
177.8% |
483.4% |
|
Share Price(1) |
1.5% |
11.3% |
(3.8%) |
201.1% |
483.8% |
|
Benchmark**(2) |
17.5% |
26.1% |
26.7% |
136.7% |
377.3% |
|
Capital return % |
1 year |
3 year |
5 year |
10 year |
MAM* |
|
NAV per share( 1) |
1.0% |
3.4% |
3.0% |
157.2% |
379.0% |
|
Share Price(1) |
0.7% |
8.6% |
(7.1%) |
176.9% |
368.3% |
|
Benchmark**(2) |
14.7% |
17.4% |
13.4% |
93.8% |
226.3% |
Sources: Morningstar Direct, Association of Investment Companies ("AIC"), Montanaro Asset Management ("MAM").
|
As at 31 March |
2026 |
2025 |
% Change |
|
Ordinary share price |
149.5p |
148.5p |
0.7 |
|
NAV per Ordinary share |
163.7p |
162.0p |
1.0 |
|
Discount to NAV(1) |
(8.7%) |
(8.3%) |
|
|
Net assets**(£'000s) |
208,411 |
291,508 |
(28.5) |
|
Market capitalisation**(£'000s) |
190,294 |
267,188 |
(28.8) |
|
Net gearing employed(1) |
5.1% |
2.1% |
|
For the year ended 31 March |
2026 |
2025 |
% Change |
|
Revenue return per Ordinary share |
1.94p |
1.50p |
29.3 |
|
Dividend per Ordinary share(1) |
1.90p |
1.31p |
18.3 |
|
Special Dividend per Ordinary share |
0.35p |
- |
- |
|
Ongoing charges(1) |
1.0% |
1.0% |
|
|
Portfolio turnover(1) |
36% |
14% |
* From 5 September 2006, when MAM was appointed as Investment Manager.
** Details provided in the Glossary on pages 70 and 71 of the Annual Report.
(1) Refer to Alternative Performance Measures on page 68 of the Annual Report.
(2) From 5 September 2006, the benchmark was the MSCI Europe SmallCap Index. The benchmark was changed on 1 June 2009 to the MSCI Europe ex-UK SmallCap Index (in Sterling terms).
Chairman's Statement
For the year ended 31 March 2026
Having served on the Board for five years, it is a privilege to have been invited to assume the role of Chairman with effect from 1 January 2026, particularly at a time of significant change for the investment company sector. I would like to thank my predecessor, Richard Curling, for his successful stewardship of the Company throughout his tenure. We benefited from his deep knowledge of investment trusts, his wisdom and his guidance through good times and some more challenging times for your Company. I look forward to working closely with my colleagues on the Board and with the Manager to continue delivering long-term value for shareholders.
Results
The year saw a continuation of the trends that have prevailed since late 2021, with Growth and Quality styles facing persistent headwinds. In a market increasingly shaped by geopolitics and the transformative development of Artificial Intelligence, the Board believes that heightened volatility is creating a rich opportunity set for active stock pickers.
Montanaro Asset Management ("Montanaro", "MAM" or the "Manager") seeks to invest exclusively in high quality growing companies based on the belief that over the long term, a company's ability to compound earnings and cash flows is the primary driver of investment returns. However, factors such as investor flows, political developments and macroeconomic fluctuations can temporarily overshadow underlying fundamentals.
The Net Asset Value ("NAV") returned 1.8% during the financial year ended 31 March 2026. In comparison, the benchmark (the MSCI Europe ex-UK SmallCap Index) returned 17.5% (in Sterling terms). The share price (with dividends reinvested) gained 1.5% as the discount to NAV widened modestly from 8.3% to 8.7%.
Net Asset Value Performance in Context
Whilst shorter term performance has suffered from significant style headwinds, long-term returns have been strong. Over ten years, your Company has delivered NAV a total return of 177.8% and a share price total return of 201.1%, outperforming the benchmark by 41.1% and 64.4% respectively. Since Montanaro were appointed in September 2006, the NAV total return has been 483.4%, 106.1% ahead of the benchmark (equivalent to an average annual outperformance of 1.1%).
Importantly, an analysis of the Company's NAV performance relative to its benchmark confirms that stock selection has added value in the 3, 5 and 10 years to 31 March 2026. In other words, the positive impact of stock selection was either fully or partly offset by strong factor headwinds, as Quality Growth companies with strong balance sheets underperformed.
Earnings and Dividends
Revenue earnings per share rose to 1.94p in the year (2025: 1.50p), reflecting strong growth from underlying portfolio companies.
A first interim dividend of 0.35p per share was paid on 5 January 2026. A second interim dividend of 1.20p will be paid on 28 August 2026 to shareholders on the register on 31 July 2026, an increase of 18.3%. In order to meet the minimum distribution requirements and to reflect the significant reduction in the number of shares in issue (excluding shares held in treasury) following the introduction of the active share buyback policy a special dividend of 0.35p will also be paid. This special dividend will also be paid on 28 August 2026 to shareholders on the register on 31 July 2026. This will bring total dividends for the year to 1.90p per share.
Share Buybacks and Treasury Shares
During the year, the Company bought back 52,637,975 Ordinary shares (this includes the 7,409,587 bought back as part of the November tender offer). As a result, the Company held 62,140,896 Ordinary shares in Treasury as at 31 March 2026. Buying back Ordinary shares at a discount is accretive to the NAV per share. As such, the buybacks conducted during the year contributed an uplift of 3.4% to the NAV per share.
Since the end of the year, the Company continued to buy back Ordinary shares and substantially utilised the authority granted at the 2025 AGM. Accordingly, the Board secured additional authority at the General Meeting convened on 1 April 2026 to cover the period until the next AGM.
Our stated policies on share buybacks and share issuances are set out on pages 18 and 32 of the Annual Report. The Board is seeking to renew the Company's share buyback and issuance authorities at the forthcoming AGM.
Tenders
The Company offers shareholders the opportunity to tender shares to the Company twice a year, around the Interim and Final Results announcements. Shares are to be bought back at a 5% discount to NAV, reflecting the higher transaction costs associated with smaller companies. Each tender is capped at 5% of shares in issue to protect existing shareholders and manage portfolio liquidity.
Following the tender offer in November 2025, a further tender offer concluded in July 2026, with 6,224,197 shares tendered. The tender offer is expected to be settled, with cash returned to participating shareholders by 30 July 2026.
Borrowings
The Board, in consultation with the Manager, regularly reviews the gearing strategy of the Company and approves any gearing facility. Gearing amplifies the returns from underlying profits or losses generated by the investment portfolio.
The Board has set a maximum limit on borrowing (net of cash) of 30% of shareholders' funds at the time of borrowing. At the end of the financial year, the Company had borrowings (net of cash) of 5.1% compared to 2.1% at the beginning of the year.
The Company's borrowing facilities with ING are due to expire in September 2026. Following a review of the Company's financing arrangements, the Board is contemplating execution of a new borrowing facility with BNY upon expiry of the existing facilities.
Environmental, Social and Corporate Governance ("ESG")
The Board and Montanaro believe that strong ESG practices are closely linked to a company's ability to create long-term value for its shareholders. ESG considerations are therefore embedded within their definition of "Quality" and have been a fundamental part of their investment process for many years.
The ESG Report within the Annual Report outlines developments in Montanaro's approach to ESG, their ongoing commitment and their engagement with investee companies.
Engaging with our Shareholders
Over the past few years, the composition of our shareholder base has changed significantly with an increasing number of individual investors coming onto the register via investment platforms. We are keen to encourage an open dialogue to keep all shareholders up to date with key developments. Our website - www.montanaro.co.uk/trust/mesct - is continually updated with factsheets, reports, presentations, webinar recordings and commentaries as well as more details about the Manager, investment philosophy and process. We encourage shareholders to visit regularly and welcome any feedback and suggestions.
We would also encourage shareholders to sign up to receive regular updates by email and to follow the Trust's dedicated LinkedIn page here.
Annual General Meeting
The AGM will be held at the offices of Montanaro Asset Management, 53 Threadneedle Street, London EC2R 8AR, on 8 September 2026 at 2.30 p.m. Shareholders are encouraged to attend the Meeting where there will be an opportunity to meet and ask questions of the Board and the Manager.
Detailed instructions on how to vote on the AGM resolutions are provided on pages 79 to 81 of the Annual Report. We encourage all shareholders to review this guidance and ensure their votes are submitted.
Additionally, the AIC has prepared information on how to vote across the most common investment platforms, this guidance is available at - www.theaic.co.uk/how-to-vote-your-shares.
Outlook
Performance since 2022 has been challenging and the Board has spent considerable time analysing the underlying drivers. Encouragingly, given the Manager's bottom-up approach, stock selection has remained positive over 3, 5, and 10 years, indicating that the investment process continues to add value. The recent period of underperformance has been driven primarily by pronounced and persistent style headwinds, with sectors such as Banks, Energy and Mining outperforming at the expense of those companies that demonstrate consistent attirbutes of Quality and Growth companies.
Against this backdrop, the fundamentals of the portfolio remain robust. The companies in which we invest are well diversified by sector and geography, and continue to demonstrate resilient business models, supported by leading positions in niche markets and high returns on capital. Over the long term, this has translated into attractive growth, with the portfolio delivering annualised EPS growth of 15.4% and revenue growth of 12% per year over the past decade. While earnings growth moderated in the period following COVID, it recovered through 2025 and consensus expectations are for it to accelerate further in 2026. Recent company updates have broadly supported this outlook, with a number of companies reporting earnings ahead of expectations and upgrading guidance.
Importantly, this growth has not been reliant on financial leverage. Balance sheets remain strong, with approximately half of portfolio companies holding net cash, providing resilience in a more uncertain macroeconomic environment.
The past year has been characterised by heightened geopolitical uncertainty, including the ongoing conflict in Ukraine, escalating tensions in the Middle East and the re-emergence of trade frictions. At the same time, rapid advances in Artificial Intelligence have driven significant shifts in market leadership. This has contributed to a narrow concentration of capital in a small number of large global technology companies, often at the expense of smaller companies and software businesses. In some cases, this has led to indiscriminate selling, despite the fact that many of these companies are either beneficiaries of, or well positioned to adapt to, these technological developments.
These dynamics have weighed on sentiment towards European smaller companies more broadly. Persistent inflows into global and US-focused strategies - particularly ETFs which elevated exposure to the largest AI beneficiaries - have left European smaller companies trading at a significant discount to larger peers. This valuation gap is now close to historic extremes. In our view, such conditions create the potential for a meaningful re-rating should capital flows begin to normalise.
Europe ex-UK Small v. Market - 12 month forward P/E
(MSCI Europe ex-UK SmallCap v. MSCI Europe ex-UK Index, GBP)
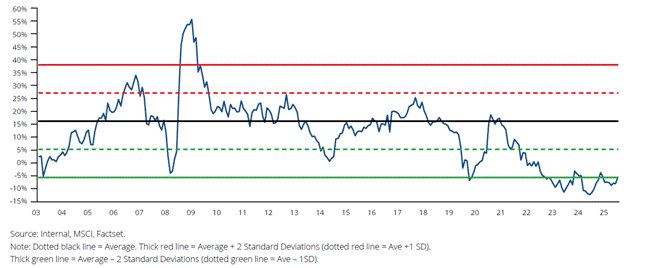
In summary, while recent performance has been challenging, the underlying drivers of long-term value creation remain firmly in place. The portfolio is characterised by high-quality, structurally growing companies with strong balance sheets and improving earnings momentum, yet it is valued at approximately 20x forward earnings, towards the lower end of its historical range. The Directors and the Manager purchased over £450,000 of shares in the Company in March 2026. Following these purchases, the Board, the Manager and employees of the Manager collectively own approximately 12% of the Company's issued share capital (excluding shares held in Treasury), underlining strong conviction and alignment of interests with all shareholders.
GORDON NEILLY
Chairman
21 July 2026
Manager's Report
The Attractions of Quoted European Smaller Companies ('SmallCap')
The key attraction of investing in smaller companies is their long-term record of delivering higher returns to investors than large companies. In the UK, over the last 71 years, this has amounted to an average of 2.8% per annum (the "SmallCap Effect"). £1 invested in UK large companies on 1 January 1954 would now be worth £1,900 whereas the same £1 invested in smaller companies would now be worth £11,311 - almost six times more.
There is less comprehensive data on Europe - it only goes back to 1999. However, it suggests that the SmallCap Effect is even more pronounced on the Continent: as the chart below illustrates, European 'small' companies have outperformed 'large' companies by 4.4% per annum.
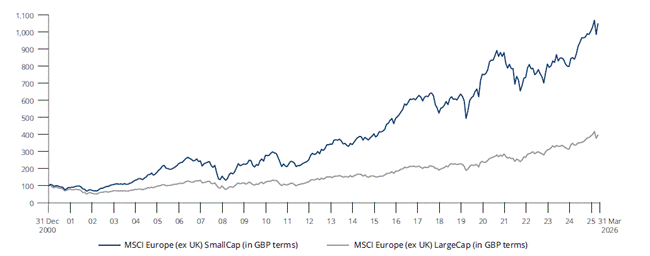
Remarkably, European SmallCaps have returned 9.5% per annum (in Sterling terms) since the turn of the century, thereby outperforming the vast majority of SmallCap markets around the world including the UK, Japan, Australia, the BRICs and even the USA (based on the Russell 2000 Index).
The market for European smaller companies is inefficient. While some large companies are analysed by more than 50 brokers, many smaller companies in Europe have little or no coverage. We believe that this makes it easier for those with a high level of internal resources to identify attractive, undervalued and overlooked investment opportunities. This in turn makes it possible to deliver long-term performance over and above that of the benchmark.
Montanaro Asset Management
Montanaro was established in 1991. We have one of the largest and most experienced specialist teams in the UK dedicated exclusively to researching and investing in quoted Smaller Companies. Our team of analysts and portfolio managers - which includes six different nationalities - provides the breadth and depth of resource required to conduct rigorous in-house research.
This expertise enables us to make early investments in European "hidden gems" and create a carefully constructed diversified portfolio of high-quality, fast growing European small companies, offering diversified and complementary exposure to Europe's most dynamic smaller companies.
At 31 March 2026, we were looking after around £2 billion of client assets. We have been the Manager of your Company for almost 20 years, since September 2006.
Investment Philosophy and Approach
We specialise in researching and investing in quoted smaller companies. We have a disciplined, two-stage investment process.
Stage one: identifying good businesses
In the first stage, we identify "good businesses" within our investable universe. We look for high quality companies in markets that are growing. They must be profitable; have good and experienced management; deliver sustainably high returns on capital employed; enjoy high and ideally growing profit margins reflecting pricing power and a strong market position; and provide goods and services that are in demand and likely to remain so. We prefer companies that can deliver self-funded organic growth and remain focused on their core areas of expertise, rather than businesses that spend a lot of time on acquisitions.
Conversely, we avoid those with stretched balance sheets; poor free cash flow generation; incomprehensible or heavily adjusted accounts; unproven or unreliable management; or that face structurally challenged business models with stiff competition.
A company must also pass our stringent quality and ESG checklists. ESG has been integrated into our disciplined investment process for almost two decades.
When we have identified a company that we believe is high quality, has structural growth and is well managed from a business and ESG perspective, it is reviewed by our Investment Committee before it can proceed to the next stage. Companies that do not possess these attributes are rejected.
Stage two: valuation and risk discipline
Companies that pass the first stage then undergo a valuation and risk assessment. We determine their intrinsic value, typically through a proprietary discounted cashflow analysis, to ensure they will make a "good investment" ("good businesses" and "good investments" are not always the same). The Investment Committee scrutinises the forecasts and assumptions made for each business. While the biggest risk - that we invest in poor or declining businesses - is addressed in the first stage, in stage two we take a more quantitative approach, with in-depth analysis of liquidity, factor risk and correlations and how these might affect position sizing and the subsequent portfolio characteristics. Only once this is complete will we add it to our Approved List.
Portfolio construction
Companies that are on the Approved List and which we also believe are attractively valued are then eligible for inclusion in your portfolio.
Our Investment Team use their industry knowledge and a range of proprietary screens to continually search for new ideas. With thousands of quoted companies from which to choose, we are spoilt for choice.
Deep fundamental research
We believe that a deep understanding of a company's business model and the way it is managed are essential. We visit our investee companies on a regular basis. We examine management's past track record in detail as we seek to understand their goals and aspirations. In smaller companies, the decisions and motivation of the entrepreneurial management can make or break a company, which is why meeting them is so important. We look closely at the board structure; the level of insider ownership; and examine remuneration and corporate governance policies carefully.
Once a company has been added to the portfolio, our investment team conducts ongoing analysis. We will sell a holding if we believe that the company's underlying quality is deteriorating or if there has been a fundamental change to the investment case or management. We will get things wrong and make mistakes, but we try to learn from them.
Long-term alignment
In summary, we invest in well managed, high quality, growing companies bought at sensible valuations. We keep turnover and transaction costs low and follow our companies closely over many years. We would rather pay more for a higher quality, more predictable company that can be valued with greater certainty. Finally, we align our interests with our investors by investing meaningful amounts of our own money alongside yours. We are significant shareholders in the Trust: MAM owns more than 10% and my colleagues and I have recently increased our personal shareholdings by 233,150 shares (see RNS).
The Portfolio
At 31 March 2026, the portfolio consisted of 47 companies of which the top ten holdings represented 36% of net assets. Sector and country distributions within the portfolio are driven by stock selection. Although weightings relative to the market are monitored, overweight and underweight positions are based on where the greatest value and upside are perceived to be.
Performance Attribution
The largest positive contributors over the period were:
Kitron - a Norwegian electronics manufacturing services company. The company reported robust results, supported by contract wins in Aerospace and Defence and a growing order backlog, providing good visibility on future growth.
Technoprobe - an Italian manufacturer of probe cards used in semiconductor testing. The company benefited from improving semiconductor demand and strong momentum in AI-related applications, supported by its leading market position.
Plejd - a Swedish developer of smart lighting and electrical products, sold primarily to professional electricians. The company delivered very strong results, with revenue growth driving margin expansion, supported by robust demand and continued traction in newer markets such as the Netherlands.
Inevitably the year was not without some stock price declines as well. The largest detractors were:
ATOSS Software - a German developer of workforce management software. The shares declined as the stock was caught up in the broader sell-off in SaaS companies linked to fears around AI disruption.
CTS Eventim - a German operator of ticketing platforms and live entertainment services across Europe. The share price fell despite strong operational performance and record ticket volumes, as the outlook was dampened by a one-off income headwind from a contract change.
Reply - an Italian IT consulting and digital services provider. Similar to ATOSS, the shares declined amid the broad sell-off in Software and IT services companies.
Portfolio Changes
While we seek to keep portfolio turnover low and invest with a long-term mindset, we are constantly searching for overlooked opportunities - hidden gems that others may have missed - which we believe can deliver attractive returns over time. Where we identify a more compelling opportunity, we may recycle capital from existing holdings. We will also sell positions where a company has outgrown our investment universe, is acquired, or where the original investment case has weakened, replacing them with new ideas from our Approved List.
The year to 31 March 2026 saw a steady level of portfolio activity, with a combination of new additions and selective disposals across the period.
New positions included I-Tech, a Swedish specialist in marine anti-fouling solutions. We also added Pfisterer, which designs and manufactures high-voltage cable systems and components used in electricity grids, and took part in the European IPO of Asta Energy Solutions, a manufacturer of specialised copper components used in transformers, generators and electric motors. Pfisterer and Asta both provide exposure to the electrification theme through the grid infrastructure and power transmission equipment needed to support growing electricity demand, itself resulting from the rapid rollout of datacentres and new renewable energy infrastructure.
Portfolio exits were driven by a mix of takeovers, valuation discipline and changes in the investment case. Fortnox, the Swedish accounting software provider, was acquired at a 38% premium following a period of strong operational performance. Elsewhere, we exited positions such as Biotage, Surgical Science, Viscofan and cBrain as the investment cases weakened, redeploying capital into more attractive opportunities.
Continual Improvement
Each year, we reflect on both our successes and mistakes to identify how our systems, processes and decision-making can be strengthened further. Continuous improvement remains central to our culture and long-term approach.
Investing in our team
During the year, we continued to invest in our investment team, recognising that talented people are our greatest competitive advantage. We strengthened our research capabilities through selective hires, adding fresh perspectives, deeper sector expertise and additional analytical resource to support idea generation and portfolio management.
We believe that combining experience with new talent helps ensure the business remains dynamic, intellectually curious and well positioned for the future.
Embracing technology and AI
We have also increased our focus on technology and artificial intelligence to enhance efficiency across both the investment process and the wider business. Our objective is not to replace human judgement, which remains at the heart of successful active management, but to equip our teams with better tools.
AI can help streamline repetitive tasks, accelerate data analysis, improve information gathering and free up time for higher-value activities such as research, debate and decision-making. We believe the thoughtful adoption of these technologies can strengthen productivity and sharpen our competitive edge over time.
Learning and evolving
For many years, we have systematically collected data on the companies we research, from initial idea generation through to exit. As this dataset has expanded, it has become increasingly valuable in helping us identify patterns and improve decision-making.
These insights are helping to refine how we source ideas, prioritise research and structure Investment Committee discussions. By combining experience, data and new technology, we aim to ensure our investment process continues to evolve and improve over time.
How to Invest
We have invested a great deal of time and effort to make the Company readily available to all investors. We have continued to grow our presence across the UK's investment platforms and are delighted to see a steady increase, year after year, in the Trust's retail following. We encourage our investors to follow the Trust via its Linkedin page here and via its website: www.montanaro.co.uk/trust/mesct.
MONTANARO ASSET MANAGEMENT
Lead Portfolio Manager; George Cooke
21 July 2026
Top 10 Holdings
as at 31 March 2026
1. Kitron - An electronics manufacturing services (EMS) provider for defence, healthcare, and electrification markets. Kitron offers resilient growth through long-term contracts, reshoring trends, and rising demand for high-reliability electronics. The company has grown its EPS (Earnings Per Share) by 17% per annum over the past decade and maintains a strong balance sheet.
2. NCAB - A global printed circuit board supplier offering premium service and logistics. With an asset-light model and consolidation strategy, NCAB delivers reliable cashflows and market share growth. The company has demonstrated strong growth since its IPO in 2018, having grown EPS at more than 20% per annum on average. Net Debt / EBITDA is low at just 1.3x.
3. Technoprobe - A leading provider of semiconductor testing solutions, specialising in probe cards. With exposure to advanced chips and structural growth in semiconductor complexity, Technoprobe benefits from strong demand in high-performance computing and AI-related applications. Technoprobe, which floated in 2022, has established itself as one of Europe's most significant AI-exposed technology companies. The company is on track to grow revenues and EBIT by approximately 50% in 2026.
4. Belimo - A global leader in actuators, valves and sensors for HVAC systems. With a focus on energy efficiency and indoor air quality, Belimo combines strong pricing power with structural growth driven by building automation and sustainability trends. The company has compounded EPS at an average rate of 12% per annum while maintaining a robust balance sheet.
5. Plejd - Develops smart lighting control systems for homes and businesses. Its intuitive products and strong network of electricians make it a high-growth disruptor in Nordic smart homes. Since reaching profitability in 2020, Plejd has grown earnings per share by more than 50% per annum and currently maintains a net cash position.
6. MTU Aero Engines - A key player in aircraft engine manufacturing and maintenance. Benefiting from global air travel recovery and a strong order book, MTU offers a powerful combination of engineering excellence and after-market revenue. Since floating on the German market in 2005, the company has been able to grow EPS at an average rate of more than 18% per annum, whilst maintain low levels of net debt.
7. Merlin Properties - A leading Spanish real estate company focused on offices, logistics and data centres. With a high-quality asset base and growing exposure to digital infrastructure, Merlin combines stable rental income with structural growth in logistics and data centre demand. The company also benefits from one of the strongest balance sheets in the sector, with a Loan-to-Value ratio currently below 25%.
8. ATOSS Software - A leader in workforce management software. Its scalable cloud solutions help companies optimise labour costs, with a high-margin SaaS model driving recurring revenue and impressive long-term growth. Over the past decade, the company has grown EPS at an annual rate of approximately 20% and maintains a robust balance sheet with a net cash position.
9. Carel Industries - A specialist in control systems and components for HVAC and refrigeration. Its solutions improve energy efficiency and system performance, supporting strong structural growth from decarbonisation and the electrification of cooling. Since listing on the Milan Stock Exchange in 2018, the company has grown its Revenue by more than 12% a year on average and EPS by more than 13% p.a..
10. VZ Holding - A Swiss financial consultancy and wealth manager with a tech-enabled platform. Its focus on fee-based advice and recurring revenues makes it a standout in a traditionally commission-driven industry. By steadily winning market share from Switzerland's large established private banks, VZ has grown EPS at an average rate of 11% per annum over the past decade, while consistently maintaining a net cash position.
Twenty Largest Holdings
as at 31 March 2026
|
Holding |
Country |
31 March 2025 Value £'000 |
Net purchases /(sales) |
Net gains /(losses)* |
31 March 2026 Value £'000 |
|
Kitron |
Norway |
13,178 |
(15,690) |
12,485 |
9,973 |
|
NCAB |
Sweden |
9,884 |
(1,198) |
1,096 |
9,782 |
|
Technoprobe |
Italy |
4,100 |
(2,155) |
6,790 |
8,735 |
|
Belimo |
Switzerland |
8,763 |
(5,269) |
3,417 |
6,911 |
|
Plejd |
Sweden |
9,563 |
(9,531) |
6,849 |
6,881 |
|
MTU Aero Engines |
Germany |
12,063 |
(6,400) |
1,073 |
6,736 |
|
Merlin Properties |
Spain |
5,774 |
(1,683) |
2,576 |
6,667 |
|
ATOSS Software |
Germany |
12,602 |
(1,819) |
(4,229) |
6,554 |
|
Carel Industries |
Italy |
4,730 |
- |
1,725 |
6,455 |
|
VZ Holding |
Switzerland |
13,270 |
(7,078) |
222 |
6,414 |
|
IMCD |
Netherlands |
8,727 |
(348) |
(2,122) |
6,257 |
|
Bachem |
Switzerland |
4,984 |
(479) |
1,628 |
6,133 |
|
Brembo |
Italy |
5,613 |
(397) |
457 |
5,673 |
|
CTS Eventim |
Germany |
11,588 |
(2,043) |
(3,885) |
5,660 |
|
Kardex |
Switzerland |
5,508 |
(588) |
664 |
5,584 |
|
Reply |
Italy |
10,103 |
(595) |
(4,215) |
5,293 |
|
Invisio |
Sweden |
7,397 |
- |
(2,179) |
5,218 |
|
Sartorius Stedim Biotech |
France |
5,313 |
- |
(230) |
5,083 |
|
Melexis |
Belgium |
5,639 |
(1,189) |
602 |
5,052 |
|
Thule |
Sweden |
6,634 |
- |
(1,754) |
4,880 |
|
Twenty Largest Holdings |
|
165,433 |
(56,462) |
20,970 |
129,941 |
*Net gains/(losses) comprise both gains/(losses) realised on the disposal of investments during the year and unrealised gains/(losses) arising on investments held at the year end.
FURTHER INFORMATION
Montanaro European Smaller Companies Trust plc's annual report and accounts for the year ended 31 March 2026 (which includes the notice of meeting for the Company's AGM) will be available today on https://montanaro.co.uk/trust/montanaro-european-smaller-companies-trust/.
It has also been submitted in full unedited text to the Financial Conduct Authority's National Storage Mechanism and is available for inspection at data.fca.org.uk/#/nsm/nationalstoragemechanism in accordance with DTR 6.3.5(1A) of the Financial Conduct Authority's Disclosure Guidance and Transparency Rules.
This information is provided by RNS, the news service of the London Stock Exchange. RNS is approved by the Financial Conduct Authority to act as a Primary Information Provider in the United Kingdom. Terms and conditions relating to the use and distribution of this information may apply. For further information, please contact rns@lseg.com or visit www.rns.com.
RNS may use your IP address to confirm compliance with the terms and conditions, to analyse how you engage with the information contained in this communication, and to share such analysis on an anonymised basis with others as part of our commercial services. For further information about how RNS and the London Stock Exchange use the personal data you provide us, please see our Privacy Policy.
ENDRNS may use your IP address to confirm compliance with the terms and conditions, to analyse how you engage with the information contained in this communication, and to share such analysis on an anonymised basis with others as part of our commercial services. For further information about how RNS and the London Stock Exchange use the personal data you provide us, please see our Privacy Policy.