
Dynacor Reports Q2-2026 Results and Updates on Tax Contingencies
MONTREAL, Aug. 13, 2026 (GLOBE NEWSWIRE) -- Dynacor Group Inc. (TSX: DNG) (“Dynacor” or the “Corporation”) today announced its unaudited financial and operational results1 for the second quarter ended June 30, 2026.
“Our Q2-2026 results reflect both strong execution and a transformative step forward in achieving our near-term expansion strategy,” said Daniel Misiano, President and CEO. “This third consecutive quarter of strong operational performance showcases the results of our optimisation projects and positions us strongly to achieve 2026 production guidance. Our operational strength translated into robust gold sales despite a double-digit dip in the gold market. The combination of gold’s sustained decline and our inventory build-up led to a longer inventory turnover, which impacted our financial performance in the quarter. We are unwinding inventory levels in the third quarter and expect margins to normalize in the second half of 2026.
Beyond our core operations, we achieved a strategic milestone in the period: first ore feed to our Galam plant, marking the beginning of our transition into a geographically diversified gold processor. With both our Senegal and Ecuador plants on track, we continue to position Dynacor to deliver long-term value for our shareholders.”
Q2-2026 Highlights¹
- Operations:
- Processed 48,300 tonnes (531 tpd), its highest quarterly throughput, and a second consecutive quarter operating above design capacity.
- Produced 31,907 gold-equivalent (AuEq) oz, among the highest historical levels.
- Financial:
- Sales of $144.4 million, the second-highest quarterly sales.
- Gross margin of $5.6 million, driven by the sharp, steady decline in gold pricing and amplified by the high inventory level:
- Gold market price declined by approximately $700/oz in the quarter: from $4,700/oz at the beginning of April to about $4,000/oz at quarter-end.
- Higher inventory than the historical average due to the build-up of buffer stock to increase supply resiliency during the presidential election period.
- EBITDA2 of $3.2 million, including $0.3 million in non-recurring expenses.
- Operating cash flows before changes in working capital items of $1.5 million.
- Net income of $1.1 million.
- Cash gross operating margin of $206 per AuEq oz sold3.
- Tax contingencies: In June 2026, the Corporation’s Peruvian subsidiary challenged the tax assessment made by the Peruvian Tax Administration (SUNAT) for the 2015 fiscal year at a hearing before the Peruvian Tax Court. The Tax Court is expected to issue its decision shortly.
- The assessment mainly relates to the validity of ore purchased from certain suppliers, which the Corporation considered as legitimate transactions and therefore tax-deductible expenses.
- The maximum aggregate amount of the Corporation’s exposure for the 2015 fiscal year including additional penalties and interest is $8.7 million.
- If Dynacor disagrees with the Tax Court’s decision, it can file an appeal before the Judicial Court. Under Peruvian law, Dynacor is required to pay the tax assessment, penalties and default interest before submitting an appeal, which routinely takes several years.
- The tax assessments made by the SUNAT for fiscal years 2016, 2017 and 2019 are also being challenged by the Corporation. The outcome of the hearing before the Tax Court for the fiscal year 2015 may have implications for the assessments relating to fiscal years 2016, 2017 and 2019, as they involve similar matters.
- The maximum aggregate amount of the Corporation’s exposure for the fiscal years 2016, 2017 and 2019 including additional penalties and interest is approximately $16.1 million.
For more information, refer to note 19 "Other commitments and other contingencies" of the Corporation's condensed interim consolidated financial statements.4 The Corporation will provide additional information when the Tax Court will have rendered its decision.
- Steady execution of international expansion:
- Senegal: First ore feed on time; hot commissioning ongoing; and pilot plant over 95% complete.
- Ecuador: Rehabilitation of Svetlana plant some 40% complete; and processing of first ore expected in Q4-2026.
- Continued focus on shareholder returns: Disbursed a monthly dividend representing CA$0.16 per share on an annual basis or a 2.4 % dividend yield based on the current share price.
- Corporate:
- Following the June 19, 2026 Annual General Meeting (AGM), Mr. Daniel Misiano was appointed President and Chief Executive Officer of Dynacor. He succeeded Mr. Jean Martineau who had held the position from 2007 until that date.
- Following the 2026 AGM, Dynacor’s Board of Directors appointed Mr. Réjean Gourde as Chair, replacing Mr. Pierre Lépine who had chosen not to stand for re-election.
- In the quarter, Dynacor released its 2025 ESG Report, outlining its sustainability performance and socio-economic contributions in 2025.
Senegal Expansion
In the quarter, construction of Dynacor’s Galam pilot plant in southeastern Senegal reached over 95% completion and the plant entered the commissioning stage, with first ore processed at quarter-end. The Corporation continues to target first gold pour in Q3-2026.
Following commissioning of the front-end process plant:
- Hot commissioning activities are progressing across the grinding, leaching, gold refining and Merrill Crowe circuits.
Operational readiness:
- Recruitment of the first plant operators and maintenance staff is ongoing.
- An initial stockpile of gold-bearing ore has been built from local suppliers, in line with Dynacor’s start-up target. Purchasing of ore from additional supplier groups is expected to continue in August.
- The assay laboratory has been fully commissioned and is in use.
- The tailings storage facility cell has been lined and is operational.
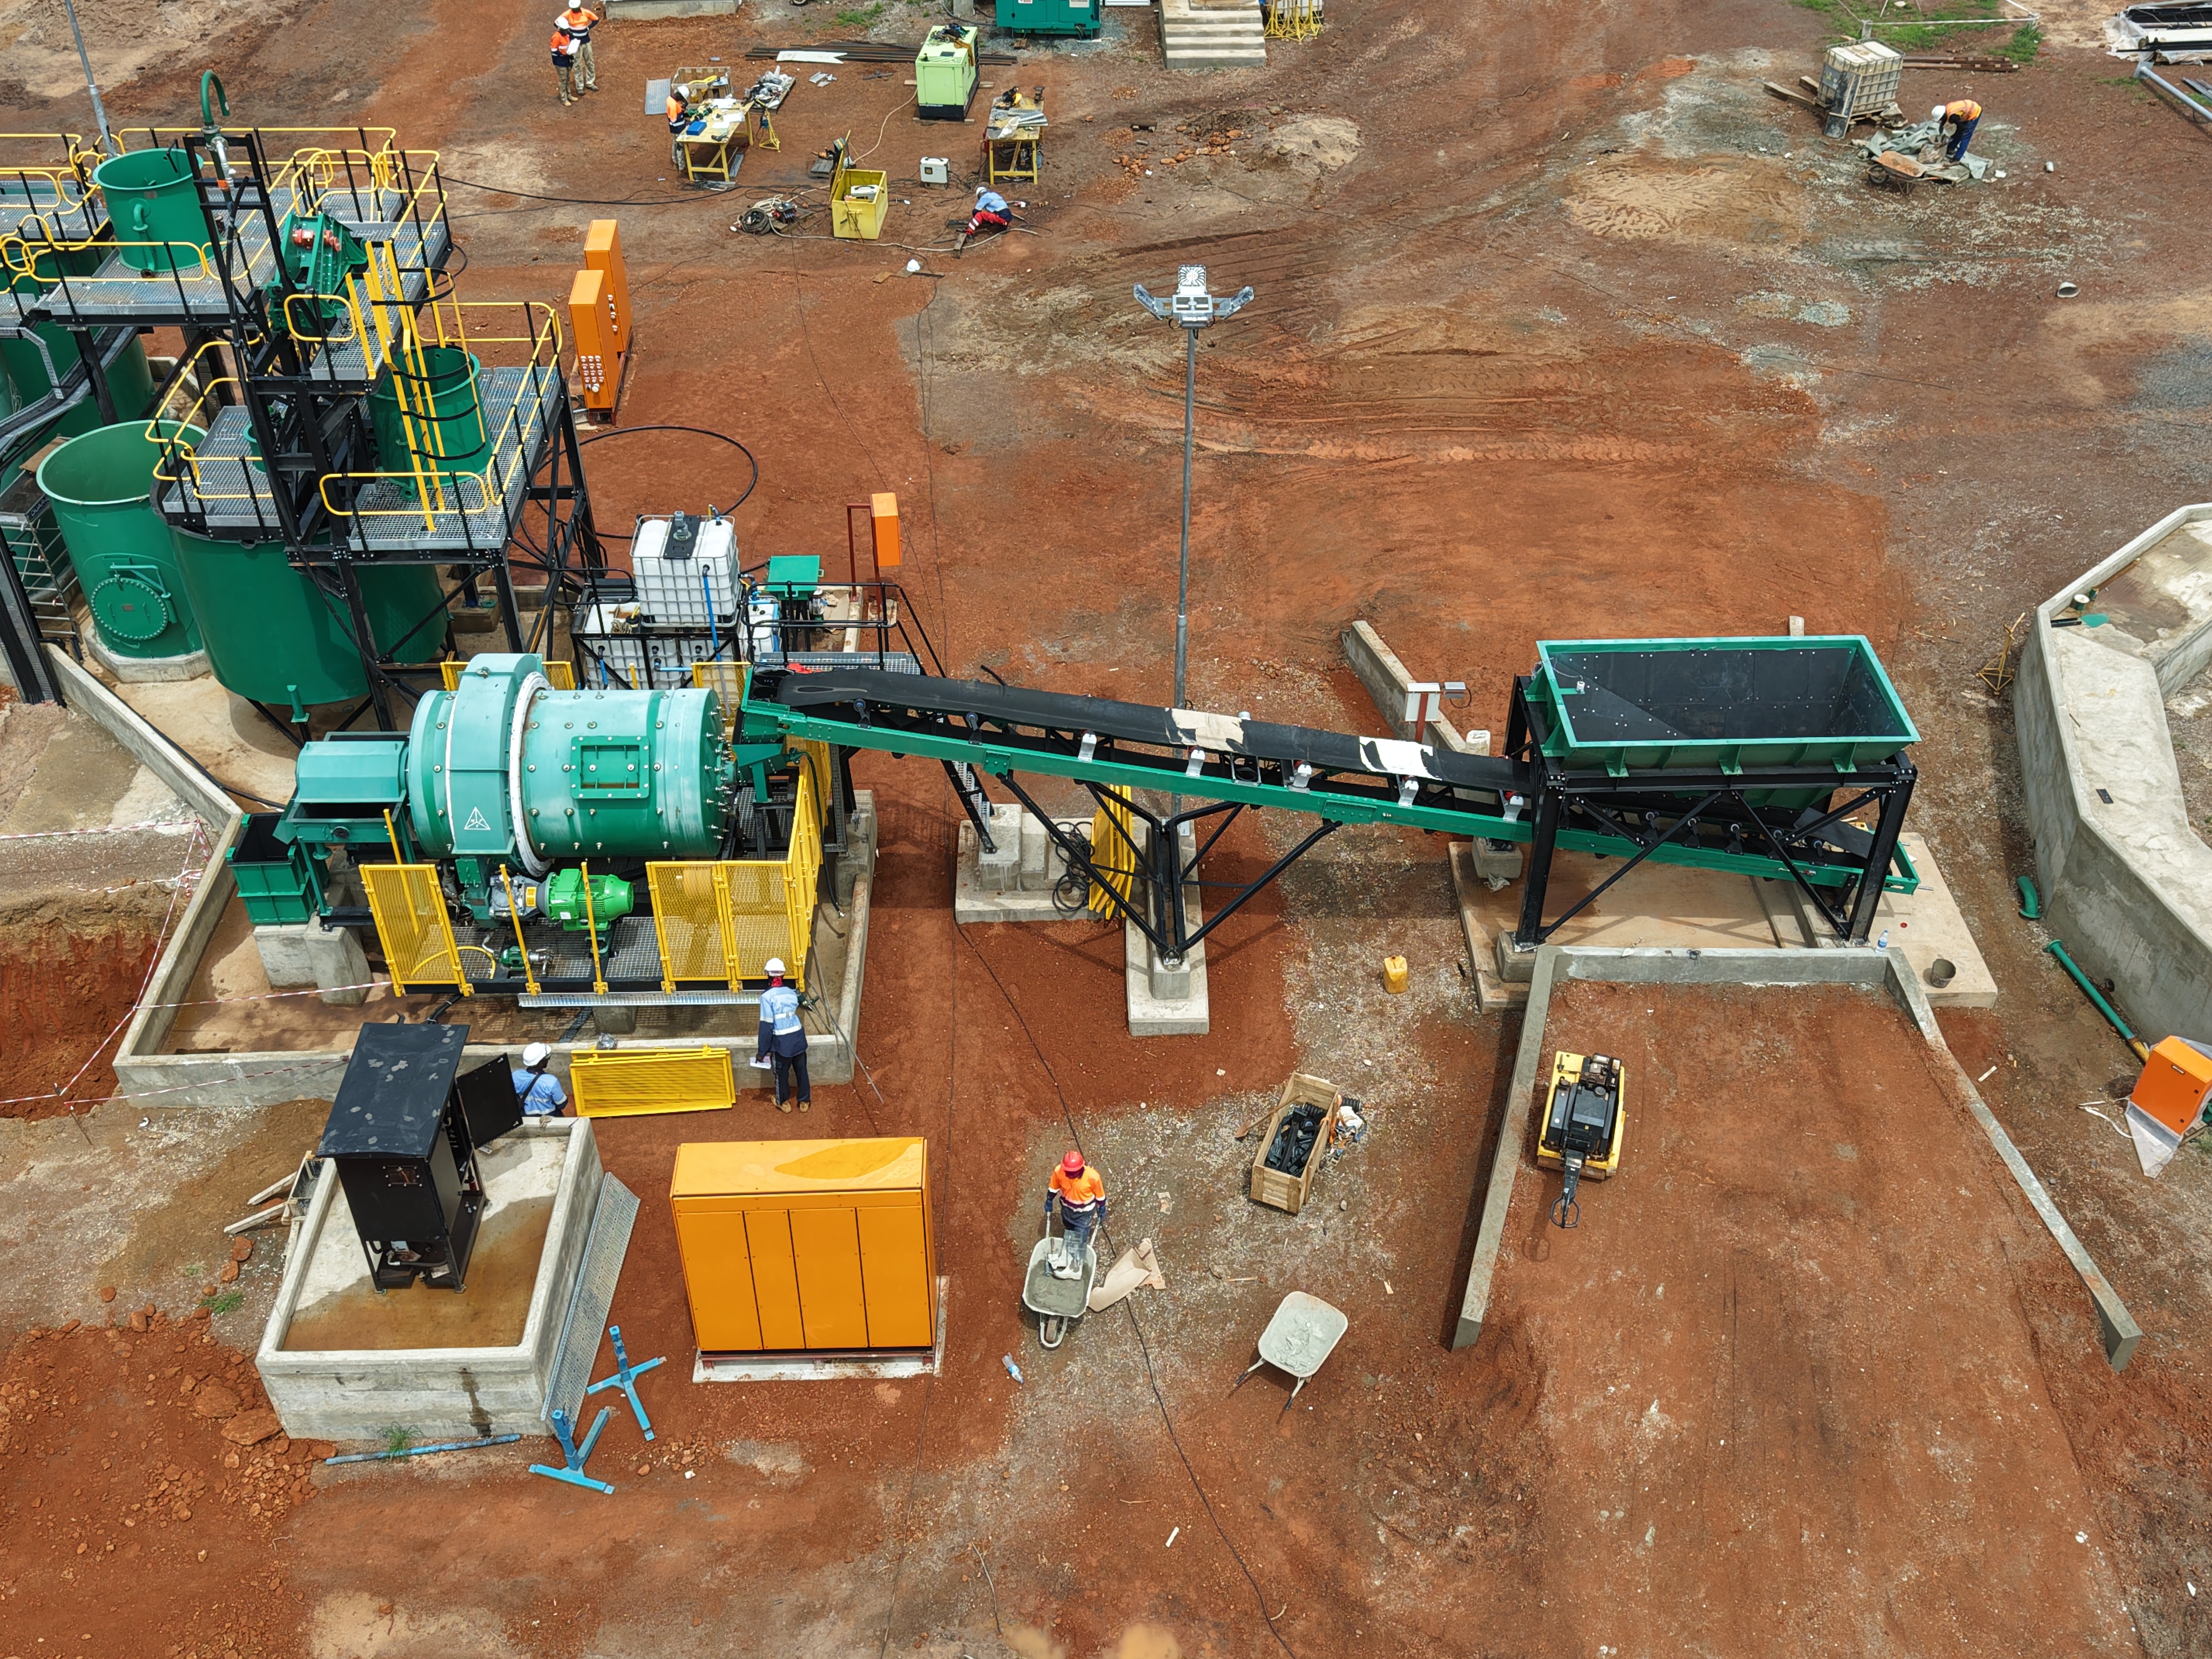
Figure 1: Ball mill commissioning activities
Ecuador Expansion
Rehabilitation work on the Svetlana processing plant has reached about 40% completion and is advancing towards the targeted Q4-2026 restart. The plan is to launch the production capacity at 300 tpd before progressively increasing to 500 tpd.
Rehabilitation of the milling circuit (ball mill area) is over 60% complete with the crushing and leaching circuits about 50% completed. Most replacement pieces of equipment have been purchased. A geotechnical review of the working tailings pond is in progress, and assessment of the assay laboratory is ongoing.
All permits are on track for Q4-2026 including an Investment Protection Agreement with the government of Ecuador and a commercialisation permit.
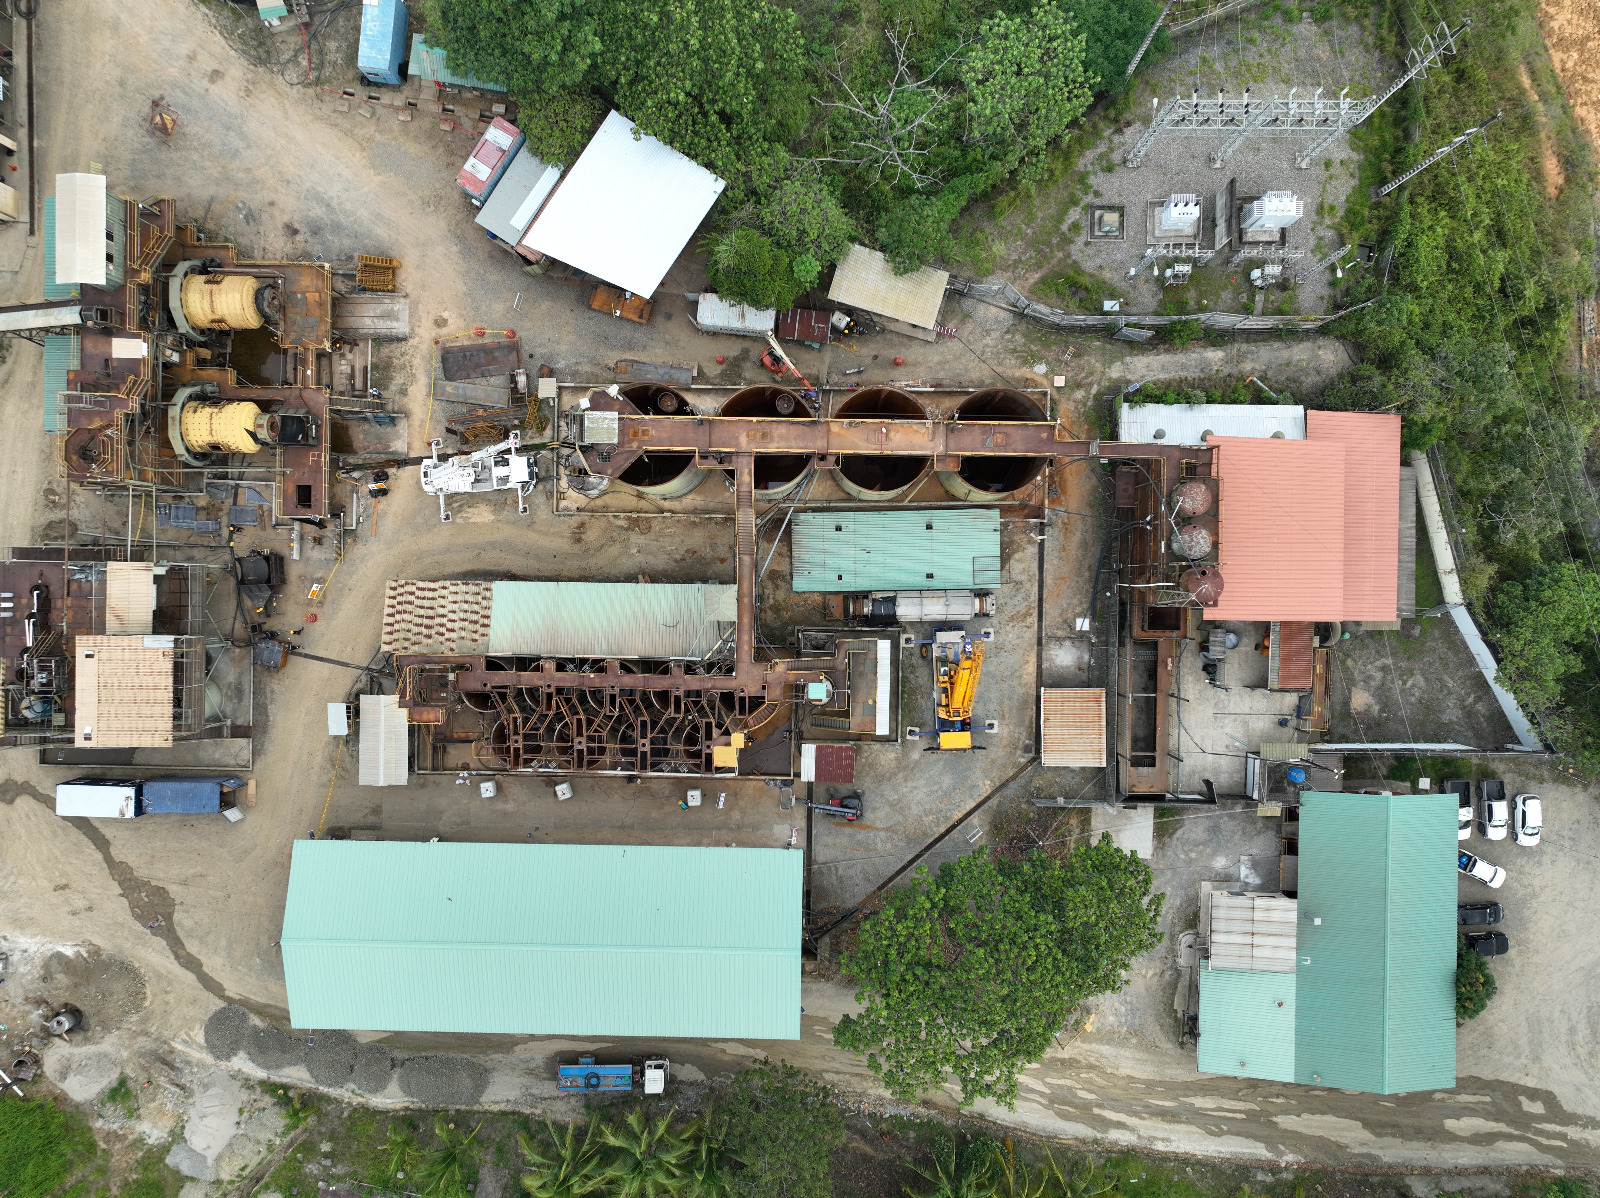
Figure 2: Overview of Svetlana processing plant
2026 Outlook versus Actuals
At quarter-end, the Corporation’s performance was tracking its 2026 guidance:
- Sales between $530-$580 million (YTD $298.5 million).
- Net income between $22-$26 million (YTD $8.4 million).
- Production between 125,000-135,000 AuEq ounces (YTD 64,698 AuEq ounces).
- Capital expenditure of $32.5-$39 million (YTD $11.1 million) to achieve the 2026 growth plan and sustain current operations of which $22-$25 million in Ecuador, $6-$8 million in Peru,
$4-$5 million in Senegal and $0.5-$1 million in other jurisdictions.
The Corporation anticipates that total 2026 capital expenditures will come in at the lower end of its guidance of $32.5-$39 million due to the completion of certain planned investments in 2027. The tightening of guidance is not expected to impact the Corporation’s 2026 operations.
A number of assumptions were made in preparing the 2026 outlook including
- Production range includes first ore from the Senegal and Ecuador plants. This estimate assumes that the Svetlana plant processes first ore in Q4-2026 and that operations exit the year at a throughput rate of approximately 150 tpd.
- Price of gold: $4,200 per ounce.
- No increase in installed operating capacity in Peru and steady ore supply.
The ore grade supplied may vary with the evolution of the gold price and the purchasing conditions. Final purchasing conditions in Ecuador and Senegal are yet to be determined.
As most of the Corporation's cost of sales relates to the daily purchasing of ore, its margin and net income are favourably (unfavourably) impacted by the inventory level at quarter-start, the gradual appreciation (depreciation) of the gold price, and by the ore supply in the period.
Operations Overview
| Three-month periods ended June 30, | Six-month periods ended June 30, | |||||
| 2026 | 2025 | 2026 | 2025 | |||
| Volume processed (in tonnes) | 48,300 | 38,152 | 94,955 | 81,493 | ||
| Tonnes per day | 531 | 419 | 525 | 450 | ||
| AuEq ounces produced | 31,907 | 24,955 | 64,698 | 52,005 | ||
- During Q2-2026, the Corporation processed a record 48,300 tonnes (531 tpd on average), record quarterly throughput and a significant increase compared to Q2-2025.
- Strong production in Q2-2026 was mainly driven by higher tonnes processed, and improved recovery rates compared to Q2-2025.
Financial Overview
| Three-month periods ended June 30, | Six-month periods ended June 30, | ||||||||
| (in $'000) (unaudited) | 2026 | 2025 | 2026 | 2025 | |||||
| Sales | 144,423 | 79,706 | 298,510 | 159,674 | |||||
| Cost of sales | (138,795 | ) | (72,560 | ) | (275,490 | ) | (143,552 | ) | |
| Gross operating margin | 5,628 | 7,146 | 23,020 | 16,122 | |||||
| General and administrative expenses | (4,006 | ) | (3,315 | ) | (7,869 | ) | (5,719 | ) | |
| Other project expenses | (18 | ) | (517 | ) | (83 | ) | (991 | ) | |
| Operating income | 1,604 | 3,314 | 15,068 | 9,412 | |||||
| Financial income net of expenses | (10 | ) | 302 | (87 | ) | 512 | |||
| Write-off of exploration and evaluation assets | (4 | ) | (8 | ) | (4 | ) | (8 | ) | |
| Foreign exchange gain (loss) | 413 | 1,390 | (613 | ) | 1,665 | ||||
| Income before income taxes | 2,003 | 4,998 | 14,364 | 11,581 | |||||
| Current income tax expense | (1,138 | ) | (1,416 | ) | (5,947 | ) | (3,189 | ) | |
| Deferred income tax (expense) recovery | 262 | (113 | ) | 33 | 226 | ||||
| Net income and comprehensive income | 1,127 | 3,469 | 8,450 | 8,618 | |||||
| Earnings per share | |||||||||
| Basic | $0.03 | $0.08 | $0.20 | $0.21 | |||||
| Diluted | $0.03 | $0.08 | $0.20 | $0.21 | |||||
Q2-2026 Quarterly Results
- During Q2-2026, the gold price decreased from an average of approximately $4,700/oz in April to around $4,200/oz in June, before ending the quarter at approximately $4,000/oz, negatively impacting gross margin.
- Total sales amounted to $144.4 million compared to $79.7 million in Q2-2025. The $64.7 million increase is explained by the higher average gold sales price (+$37.3 million), in combination with the higher volumes of gold ounces sold (+$27.4 million) mainly due to the higher tonnes of ore processed.
- The Q2-2026 gross operating margin reached $5.6 million (3.9% of sales) compared to $7.1 million (9.0% of sales) in Q2-2025. The current quarter was unfavorably impacted by the sustained decrease in gold prices throughout the quarter, combined with higher inventory levels throughout the quarter.
- General and administrative expenses totaled $4.0 million in Q2-2026 compared to $3.3 million in Q2-2025. The increase is primarily attributable to the expansion of the management team to reinforce organizational capacity and processes in the context of the Corporation’s international expansion.
- Foreign exchange result was mainly impacted by the revaluation of monetary assets and liabilities denominated in Peruvian sol due to fluctuations in the Peruvian sol against the US dollar.
- A $0.9 million income tax expense was also recorded during Q2-2026, compared to $1.5 million in Q2-2025. The effective tax rate continues to be influenced by the variance throughout the period of the Peruvian sol against the US$, which is the Corporation’s functional currency. Future fluctuations will positively or negatively affect the current and deferred tax at the end of each period.
Q2-2026 Year-To-Date Results
- During the six-month period ended June 30, 2026, the gold price increased from approximately $4,400/oz in January to approximately $5,400/oz in February, before declining to approximately $4,000/oz by the end of June, impacting the Corporation’s financial results for the period.
- Total sales for the six-month period ended June 30, 2026, amounted to a record $298.5 million, compared to $159.7 million for the same period in 2025. The $138.8 million increase is explained by the higher average gold price (+$100.5 million), in combination with the higher quantities of gold-equivalent ounces sold (+$38.3 million) due to the higher tonnes of ore processed and improved recoveries.
Cash Flows, Working Capital and Liquidity Overview
| Three-month periods ended June 30, | Six-month periods ended June 30, | ||||||||
| (in $'000) (unaudited) | 2026 | 2025 | 2026 | 2025 | |||||
| Operating activities | |||||||||
| Net income, adjusted for non-cash items | 1,515 | 4,156 | 11,585 | 9,955 | |||||
| Changes in working capital items | (9,634 | ) | (2,849 | ) | (16,850 | ) | 6,837 | ||
| Net cash (used in) from operating activities | (8,119 | ) | 1,307 | (5,265 | ) | 16,792 | |||
| Investing activities | |||||||||
| Change in short-term investments | - | 3,000 | - | 3,000 | |||||
| Acquisition of property, plant and equipment, net of proceeds from disposal and other | (6,967 | ) | (818 | ) | (10,875 | ) | (2,122 | ) | |
| Net cash (used in) from investing activities | (6,967 | ) | 2,182 | (10,875 | ) | 878 | |||
| Financing activities | |||||||||
| Issuance of common shares | - | - | - | 20,433 | |||||
| Repurchase of common shares | - | (1,162 | ) | - | (1,162 | ) | |||
| Dividends paid | (1,217 | ) | (1,209 | ) | (2,447 | ) | (2,324 | ) | |
| Other | (93 | ) | 18 | (20 | ) | 74 | |||
| Net cash (used in) from financing activities | (1,310 | ) | (2,353 | ) | (2,467 | ) | 17,021 | ||
| Change in cash during the period | (16,396 | ) | 1,136 | (18,607 | ) | 34,691 | |||
| Effect of exchange rate fluctuations on cash | 505 | 954 | (113 | ) | 878 | ||||
| Cash, beginning of the period | 30,659 | 53,298 | 33,488 | 19,819 | |||||
| Cash, end of the period | 14,768 | 55,388 | 14,768 | 55,388 | |||||
Investing activities
- In Q2-2026, Dynacor invested $7.1 million in capital expenditure of which $1.9 million was applied toward the construction of the ore-processing pilot plant in Senegal, $3.9 million in Ecuador and $1.3 million in Peru, mainly to maintain or improve plant efficiency.
Working Capital and Liquidity
- As at June 30, 2026, the Corporation’s working capital amounted to $79.4 million, including $14.8 million in cash ($81.9 million, including $33.4 million in cash as at December 31, 2025). The variances are mainly due to increases in inventory and sales tax receivables.
Consolidated Statement of Financial Position
As at June 30, 2026, total assets amounted to $187.8 million ($181.5 million as at December 31, 2025). Major variances since year-end 2025 are mainly explained by higher inventory and additions to property, plant and equipment that have partially lowered cash levels. Total liabilities remained generally consistent over the period.
| As at June 30, | As at December 31, | |
| (in $'000) (unaudited) | 2026 | 2025 |
| Cash | 14,768 | 33,488 |
| Accounts receivable | 33,250 | 37,221 |
| Inventories | 57,959 | 39,016 |
| Prepaid expenses and other assets | 1,394 | 516 |
| Current tax assets | 2,584 | 2,158 |
| Property, plant and equipment | 58,198 | 49,442 |
| Exploration and evaluation assets | 18,583 | 18,575 |
| Right-of-use assets | 592 | 625 |
| Deferred tax assets | 452 | 418 |
| Total assets | 187,780 | 181,459 |
| Trade and other payables | 30,224 | 30,417 |
| Asset retirement obligations | 14,863 | 14,830 |
| Lease liabilities | 485 | 520 |
| Share unit plan liabilities | 1,118 | 790 |
| Shareholders' equity | 141,090 | 134,902 |
| Total liabilities and shareholders’ equity | 187,780 | 181,459 |
About Dynacor
Dynacor Group is an ore processing company dedicated to producing gold sourced from artisanal miners. Since its establishment in 1996, Dynacor has pioneered a responsible mineral supply chain with stringent traceability and audit standards for the fast-growing artisanal mining industry. By focusing on formalized miners, the Canadian company offers a win-win approach for governments and miners globally. Dynacor operates the Veta Dorada plant and owns a gold exploration property in Peru. The company is expanding to West Africa and within Latin America.
The premium paid by luxury jewellers for Dynacor’s PX Impact® gold goes to Fidamar Foundation, an NGO that mainly invests in health and education projects for artisanal mining communities in Peru. Visit www.dynacor.com for more information.
Forward-Looking Information
Certain statements in the preceding may constitute forward-looking statements, which involve known and unknown risks, uncertainties and other factors that may cause the actual results, performance, or achievements of Dynacor, or industry results, to be materially different from any future result, performance or achievement expressed or implied by such forward-looking statements. These statements reflect management’s current expectations regarding future events and operating performance as of the date of this news release.
Statements related to Dynacor projected revenues, earnings, growth rates, revenue and expansion plans, the estimated liability resulting from the tax reassessment of the SUNAT, the result of the court hearing, the timing of delivery of tax court decision and the Corporation's defense of its position are forward looking statements as are any statements relating to future events, conditions or circumstances. The use of terms such as “believes”, “expects”, “will”, “intends”, “projects”, “anticipates”, “estimates”, “predicts”, “aims”, “targets”, “would”, “could”, “may”, “should”, “likely”, “plans”, “forecasts”, “continues”, or similar terms or the negative thereof are intended to assist in identification of these forward-looking statements. By its nature, forward looking information involves numerous assumptions, known and unknown risks and uncertainties, both general and specific, that contribute to the possibility that the predictions, forecasts, projections and other forward-looking statements will not occur and may cause actual results to differ materially from those anticipated in such forward-looking statements. Therefore, readers are cautioned not to place undue reliance upon any such forward-looking statements.
Many factors could cause the actual results of the Corporation to differ materially from the results, performance, achievements or developments expressed or implied by such forward-looking statements, including, without limitation, each of the following factors, which are discussed in further detail in the Corporation’s most recent annual information form available on SEDAR+ (www.sedarplus.ca), metal price volatility, foreign exchange rate fluctuations, political, country and exportation risks, tax matters, supply and quality of feedstock, water supply, labour and employment relations, production and cost estimates, access to capital markets and future financing; execution of expansion; reputational risk; environmental matters, licenses and permits, competition, dependence on management, insurance risk, litigation, anti-corruption laws, mining industry and mining projects; risks related to statutory and regulatory compliance, cybersecurity threats, share price volatility, increased costs and compliance risks of being a public corporation and pandemics. The forward-looking statements contained herein are expressly qualified in their entirety by this cautionary statement. The Corporation disclaims any obligation to update or revise these forward-looking statements except as required by applicable law.
Contact:
For more information, please contact:
Ruth Hanna
Director, Investor Relations
T: 514-393-9000 #236
E: investors@dynacor.com
Website: http://www.dynacor.com
Renmark Financial Communications Inc.
Bettina Filippone
T: (416) 644-2020 or (212) 812-7680
E: bfilippone@renmarkfinancial.com
Website: www.renmarkfinancial.com
____________________________
1 All figures are in US dollars unless stated otherwise. All variance % are calculated from rounded figures. Some additions might be incorrect due to rounding.
2 EBITDA: “Earnings before interest, taxes and depreciation” is a non-IFRS financial performance measure with no standard definition under IFRS Accounting Standards. It is therefore possible that this measure may not be comparable with a similar measure of another corporation. The Corporation uses this non-IFRS measure as an indicator of the cash generated by the operations and allows investors to compare the profitability of the Corporation with others by canceling effects of different asset bases, effects due to different tax structures as well as the effects of different capital structures. EBITDA is calculated on page 18 of the Corporation’s MD&A for the three- and six-month periods ended June 30, 2026, with additional information provided in section 17, “Non-IFRS Measures.”
3 Cash gross operating margin per AuEq ounce is in US$ and is calculated by subtracting the average cash cost of sale per equivalent ounce of Au from the average selling price per equivalent ounce of Au and is a non-IFRS financial performance measure with no standard definition under IFRS Accounting Standards. It is therefore possible that this measure may not be comparable with a similar measure of another company. Cash gross operating margin per AuEq ounce is calculated on page 16 of the Corporation’s MD&A for the three and six-month periods ended June 30, 2026, with additional information provided in section 17, “Non-IFRS Measures.”
4 The Corporation's condensed interim consolidated financial statements as at June 30, 2026 and for the three-month and six-month periods ended June 30, 2026 (unaudited).
Photos accompanying this announcement are available at
https://www.globenewswire.com/NewsRoom/AttachmentNg/bbb36f1a-d088-4efe-bc36-1be0dea22662
https://www.globenewswire.com/NewsRoom/AttachmentNg/43f65178-2d83-4c6e-8e5b-d8c1f66ad4a3
