

Scaling our AI platform to sustain 25%+ growth, balancing gross profit generation with disciplined investment in customer acquisition, supported by structural productivity gains.
São Paulo, August 4th, 2026
Key Highlights – Q2 2026
Portfolio
•Third consecutive quarter of record Origination at R$1.14bn (+34.2% YoY and +2.2% QoQ). We posted another record high in quarterly origination volume, powered by the growing role of AI-driven automation across our end-to-end origination and underwriting, combined with robust momentum in all product ecosystems.
•Portfolio reached R$8.1bn or +26.4% YoY (+7.0% QoQ), advancing firmly on track with our 25%+ annual growth target. This reflects the compounding effect of consecutive record origination quarters, despite the revised market backdrop with SELIC remaining higher for longer in Brazil.
Financials
•Revenues accelerated to R$722.9mn with strong growth of +30.2% YoY and +14.2% QoQ, driven by the continued scaling of our portfolio and consistent pricing execution,with sequential growth further supported by inflation indexing in our Home Equity portfolio.
•Gross Profit outpaced revenue growth YoY to reach R$271.6mn (+36.0% YoY and +7.1% QoQ), reflecting the structural improvements in our unit economics. Gross Profit Margin stood at 37.6%, impacted by the increased IPCA-driven revenue mix, which carries lower percentage margins, while underlying spreads, cohort economics, and credit quality held steady despite growth impact on provisioning front-loading.
•Operating Costs and Expenses totaled R$305.3mn (+10.1% YoY and +5.9% QoQ), growing well below revenue growth on both a sequential and annual basis and now representing 42.2% of our revenues (down from 50.0% one year ago and 45.6% last quarter). Ongoing efficiency gains across our operations, driven by automation and our AI execution, continue to unlock structural capacity and lower cost-to-originate metrics.
•Operating loss remained flat at R$33.7mn (vs. R$34.9mn in Q1-26), underscoring our position on maintaining a neutral operation, while optimizing investments in highly profitable growth.
Operations
•Origination reaching a new record high for the third consecutive quarter, with broad-based momentum across our business units. Auto Finance (+19.7% QoQ) and e-Consignado (+28.4% QoQ) led the expansion, while Auto Equity and Home Equity sustained a disciplined, margin-focused pace. Critically, this record was delivered with Customer Acquisition Costs reaching historical low level as a percentage of origination, as AI automation across our end-to-end origination and underwriting continue allowing us to scale volumes without a proportional increase in acquisition spend.
•We continued to accelerate our AI Platform across all business units in Q2-26, with AI agents running in production across end-to-end origination, underwriting, collections, customer service, back office and software development. Key operational milestones include:
-Collections: our AI agent now handles 100% of early-stage chat contacts for Auto delinquencies. It outperforms human operators on both conversion and customer satisfaction (CSAT of 4.5 vs 4.0) and made human handoffs fall from 25% to 12%, meaning 88% of conversations are resolved end-to-end without human intervention.
-Sales & Origination: our AI sales agent now out-converts human consultants in its target segments. It manages 95% of customer engagement and 80% of document processing, while continuing to expand its coverage in Auto Equity origination – now reaching 20%, up from 5% previously.
-Back Office & Underwriting: document-processing agents are now operating at over 90% accuracy. This enables touchless credit decisions, leading to our first fully automated loan approval in Auto Finance on July 30th, with zero human review.
-Software Development: our AI-driven development pipeline now manages most of the merged code, with AI-based pull requests (PRs) accounting for 87% of all code merged in July. PRs per active developer rose from 9.9 in March to 16.4 in July.
Q2-26 reinforces the trajectory we have been building: advancing scale alongside expanding operational efficiency. On an annualized basis, our second-quarter performance underscores the continued momentum in our business model, delivering over R$4.5bn in annualized origination to project R$8.8bn year-end portfolio (+24% YoY), with annualized revenues above R$2.9bn and our run-rate operating loss reduced to less than half of last year’s level. Each quarter on this path compounds the value of our platform and expands our income-generating asset base. As our efficiency initiatives and AI optimizations mature, we continue to accelerate operating leverage, positioning the business to enter a phase that seamlessly combines market scale with profitability.
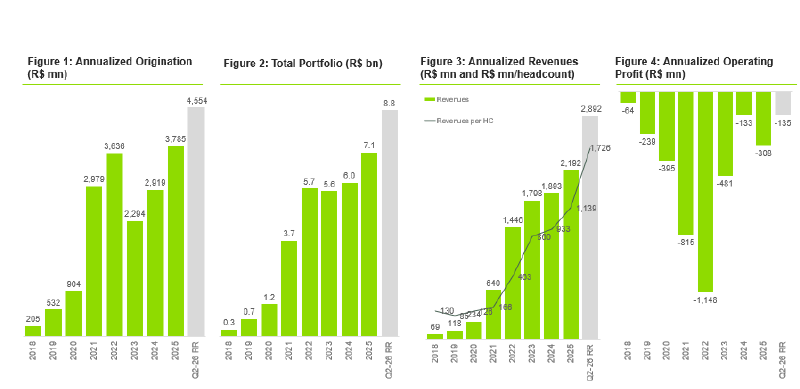
Figures 1, 2, 3 & 4: Annualized results evolution
Second Quarter Financial & Operating Results
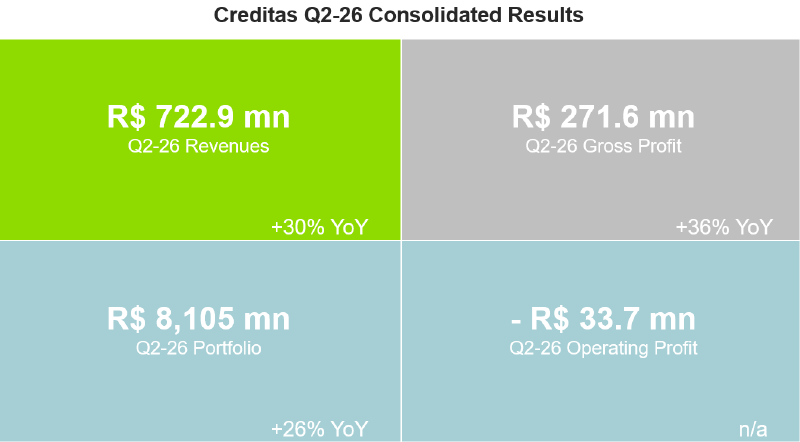
Figure 5: Summarized results
In Q2-26, we maintained our focus on profitable growth, delivering record origination and gross profit alongside continued revenue expansion. Origination increased 34.2% YoY, driving Portfolio growth to 26.4% YoY (see Figure 6 and Figure 7). Achieving a new origination record for the third consecutive quarter highlights a structural evolution from the volume-led growth of the 2020–2021 period, as we are now scaling volumes on the back of superior unit economics and disciplined cost management, even as the long-term nature of our loans delays the immediate recognition of this profitability in our IFRS results.
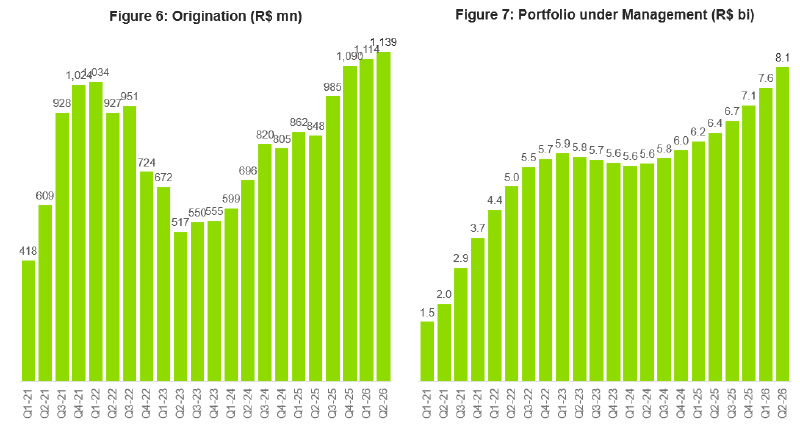
Figures 6 & 7: Origination and Portfolio under Management
The continued expansion of our Portfolio drove Revenue to a record R$722.9mn (+30.2% YoY and +14.2% QoQ) (see Figure 8), marking the third consecutive quarter of accelerating revenue. Record quarterly Gross Profit reached R$271.6mn (+36.0% YoY and +7.1% QoQ) at a 37.6% Gross Profit Margin (see Figure 9). While quarterly margin fluctuations may persist due to temporary mix shifts – such as higher inflation-driven mix this quarter – and the evolution of our funding matrix, Gross Profit growth has outpaced revenue growth on a YoY basis, evidencing the structural improvement in our credit margins despite continued impact of IFRS-provisions frontloading natural at this growth pace. Crucially, underlying cohort profitability remains firmly above our 40% target, and credit quality remained resilient across all verticals, supported by the low loan-to-value (LTV) profile of our collateralized portfolio.
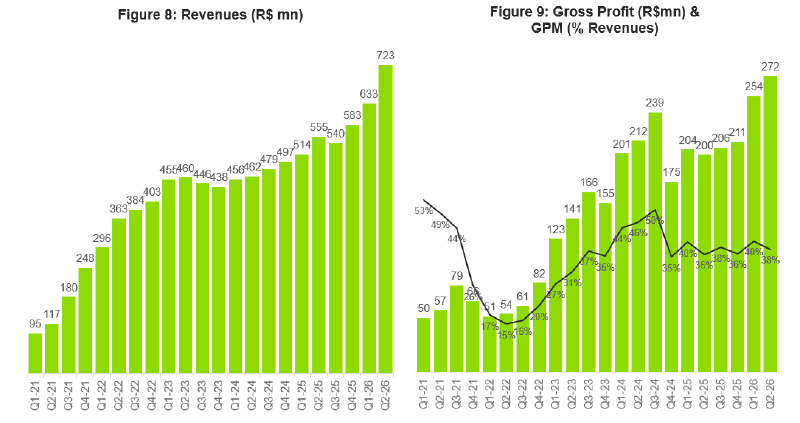
Figures 8 & 9: Revenues and Gross Profit & GPM
Operating Costs and Expenses (see Figure 10) totaled R$305.3mn (+10.1% YoY and +5.9% QoQ). Despite the sequential uptick, cost growth remained well below our 14.2% QoQ revenue expansion and represented 42.2% of the total revenue in Q2-26 (down from 50.0% in Q2-25). Most of the cost increase reflects a temporary invoice processing lag from a platform transition, a non-recurring timing effect rather than operational expansion. Customer Acquisition Costs rose slightly in absolute terms alongside record origination, but continued to decline as a percentage of origination, to reach a new all-time low, proving that AI-driven automation is progressively enabling more efficient growth. General and administrative expenses declined in the quarter, continuing to gain scale against a growing revenue base. Our focus on building an AI-first architecture continued to yield record productivity, with annualized revenue per headcount reaching a new high of R$1.7mn, a 17x increase since Q1-19 and up +21% in the last 3 months alone. Together, these compounding dynamics allow record revenues and record gross profit to convert into a materially narrower operating loss year over year. As we have consistently emphasized, unlike market practices that often outsource core functions such as technology, collections, or sales, we internalize these operations to capture superior scale gains, recognizing all acquisition and technology costs upfront while loan and insurance margins accrue over time.
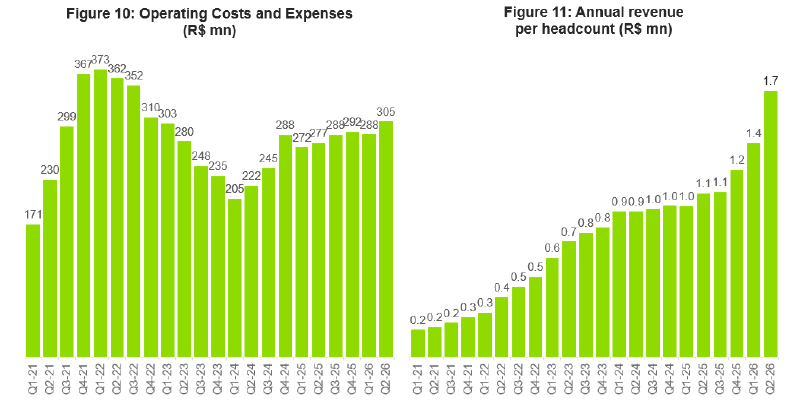
Figures 10 & 11: Operating Costs and Expenses, Annual Revenue per Headcount
Anchored by strong unit economics and short payback periods, our focus remains on reinvesting portfolio profits to fuel sustainable growth. Operating loss for Q2-26 was R$33.7mn (see Figure 12), roughtly flat versus R$34.9mn in Q1-26 and down to nearly one-tenth of its Q1-22 peak of R$321mn –even as revenues are now 2.5x higher. Achieving this stability while delivering record origination highlights how expanding gross profit and operational efficiency are simultaneously absorbing upfront growth costs and diluting our fixed overhead base. Net loss for the quarter totaled R$66.9mn (see Figure 13), an improvement from R$75.9mn in Q1-26. Importantly, we maintained a neutral cash flow position, which continues to enable us to fund our growth internally without relying on external equity capital – a key pillar of our long-term strategy. The Q2-26 results reinforce our structural playbook: scaling the platform at a 25%+ portfolio growth rate, expanding revenues and gross profit, and leveraging AI-driven efficiency to dilute operating costs – all to build an ever-growing stream of future cash-flows.
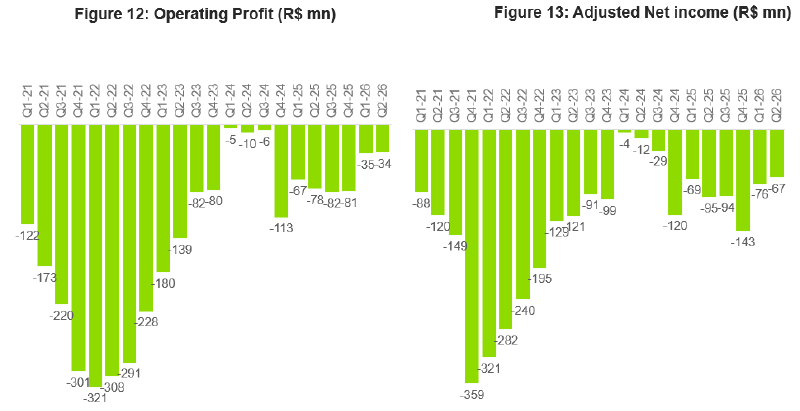
Figures 12 & 13: Operating Profit and Adjusted Net Income
Business Unit Performance
Auto Equity
Auto Equity, our flagship product, reached a new record portfolio size in Q2-26 (expanding 19.8% growth YoY), sustaining a steady origination pace through the quarter, while continuing to fine-tune risk-adjusted pricing to preserve margins amid a tight interest rate environment. Performance this quarter reinforces the product’s strong unit economics and reflects key operational milestones: scaling AI across multiple user cases in collections and automating our end-to-end journey to go from customer intention to cash disbursement in as little as nine minutes. Looking ahead, substantial operating leverage remains to be unlocked as we further scale the platform.
Home Equity
Home Equity's portfolio continued to expand at a robust pace in Q2-26, growing 31.6% YoY and solidifying our leading market position. This performance continues to be underpinned by ongoing acquisition funnel optimization and an increasingly AI-driven operation, ranging from back-office underwriting automation to a new AI-powered customer engagement agent now being scaled across our lead base.
Private Employees Payroll Loans
Building on increased visibility into e-Consignado unit economics and normalized operational processes, we expanded our private payroll loans portfolio by 23.7% YoY in Q2-26. By introducing FGTS and severance-backed transactions to our offering, alongside growing product momentum, we broadened our private-sector employee coverage to approximately 22%.AI is now embedded across origination and portfolio management, as part of a roadmap to further scale its deployment. Moreover, the user journey increasingly leverages the core modules validated in Auto Equity — such as identity verification, document analysis, and contracting – embodying our ‘build-once, deploy everywhere’ platform architecture.
Auto Finance
Auto Finance continued to scale in Q2-26, with the portfolio expanding 51.3% YoY and extending its strong multi-quarter growth trajectory. This expansion was increasingly supported by an AI-powered initiative that reactivated origination across previously disengaged dealers, complemented by a refined risk model and a new store segmentation designed to balance profitability and volume. Looking ahead, we remain focused on shortening time-to-close and scaling credit decisioning capacity without proportional headcount additions, positioning Auto Finance for a profitable and balanced expansion.
Insurance
We continue to advance our insurance strategy by refining the customer experience, reinforcing Creditas' position as the largest independent online insurance broker in Brazil. AI has become a tangible driver of this evolution, with our renewal agent significantly boosting consultant productivity. Looking ahead, we are pursuing multiple avenues to unlock the product's full potential, including deeper cross-sell integration across the Creditas ecosystem, positioning insurance as a strategic pillar to drive further platform scale in the years ahead.
Business Outlook
Creditas continues to advance through its current growth phase, as our expanding AI capabilities further reshape how we acquire customers, underwrite credit, manage our portfolio, run our back office and engineer software. Our Q2-26 results reflect the compounding impact of AI deployments across the business, as these initiatives mature from early pilots into structural efficiency drivers across every vertical. Looking ahead, we remain focused on sustaining our 25%+ annual growth target while continuing to prioritize portfolio profitability and driving operating leverage toward sustainable profitability.
For further information, please contact:
Creditas:
Sergio Furio / Shirlei Silva
CEO / Director of Investor Relations
E-mail: Investor-relations@creditas.com
Or visit www.creditas.com and ir.creditas.com
 4379622_5.png | 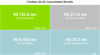 4379622_1.png | 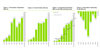 4379622_0.png | 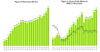 4379622_3.png | 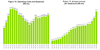 4379622_4.png | 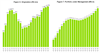 4379622_2.png |