
Audited results for the year ended 31 March 2026

Potter & Moore PLC
13 July 2026
Potter & Moore PLC
Audited results for the year ended 31 March 2026
Potter & Moore PLC ("PAM", the "Company" or the "Group"), the British-based beauty and well-being brand owner and manufacturer, is pleased to announce its audited results for the year ended 31 March 2026 ("FY26").
Financial highlights
|
Year ended 31 March 2026 |
Year ended 31 March 2025 |
Change |
|
|
|
£000 |
£000 |
|
|
Revenue |
53,849 |
54,066 |
(0.4%) |
|
Gross profit margin |
44.9% |
44.7% |
20 bps |
|
Operating profit |
2,692 |
3,531 |
(23.8%) |
|
EBITDA1 |
4,245 |
5,115 |
(17.0%) |
|
Profit before tax |
2,822 |
3,497 |
(19.3%) |
|
Diluted earnings per share |
3.04p |
3.29p |
(7.6%) |
|
Net cash2 |
3,177 |
3,022 |
5.1% |
1Earnings before interest, tax, depreciation and amortisation
2Cash and cash equivalents less short-term element of obligations under finance leases and borrowings
· Revenue - decreased by £0.3m (0.4%) to £53.8m (2025: £54.1m), with strong Private Label growth of £2.6m (9.0%) from new retailers and category expansion more than offset by a £2.9m (43.9%) decline in Contract Manufacturing due to a major customer changing priorities and overstocking. New business wins totalling £3.5m were secured during the period as a result of Private label growth and the pivot of our owned brands to include fast follow categories.
· Gross profit margin - increased by 20 basis points (bps) to 44.9% (2025: 44.7%), driven by:
o Manufacturing efficiency gains - implemented live production data systems and targeted investments to reduce changeover times, increase capacity, and lower labour costs by £0.3m.
o Procurement cost savings - negotiated extended supplier payment terms, retendering of commodity components, and improved pricing on high-volume items, delivering tangible cost benefits of £0.2m.
· EBITDA - decreased by £0.9m to £4.2m (2025: £5.1m) due to higher labour costs of which £0.9m was attributable to National Living Wage and National Insurance Contribution increases, which outweighed margin and efficiency improvements.
· Net cash on hand - increased by £0.2m to £3.2m (2025: £3.0m) due to strong working capital management.
· Proposed final dividend of 0.55 pence per ordinary share for FY26 (2025: 0.50 pence per ordinary share).
Operational highlights
On 21 April 2026, the Group changed its name from Creightons PLC to Potter & Moore PLC (PAM). The Group transitioned to the AIM Market on 31 March 2025 primarily to reduce the costs of compliance and provide greater flexibility in regulatory requirements, enabling faster management decision-making and a greater focus on growth opportunities.
During FY26, Potter & Moore PLC has continued to implement efficiency and productivity initiatives to improve profitability, reduce costs and generate positive cash flows, with actions including:
· Warehouse transformation - deployed a new Warehouse Management System (WMS) in June 2025, improving pick efficiency, reducing team hours and enhancing stock accuracy, anticipate to deliver annualised cost savings of £0.1m in the following year
· Digital production upgrade - commenced the introduction of paperless production software in October 2025 with real-time performance monitoring and online quality checks, boosting shop floor productivity and trend analysis.
· Artwork automation - commenced the roll-out of a centralised artwork tool with AI-based proofing and structured workflows, accelerating NPD (new product development) and improving accuracy
· Investment in people - Invested c.£0.4m in indirect labour to strengthen the sales function and support future revenue growth in both Private Label and Brands. This has, in part, supported the increase in Private Label performance and Brand sales in this period
· Government policy changes resulted in an increase in National Living Wage and National Insurance Contribution costs of £0.9m
· Inventory on hand decreased by £0.1m to £8.8m (2025: £8.9m) reflecting the Group's controlled approach to stock management
· The Board intends to align the board structure to one appropriate for the Group's size and complexity. Mr Nick O'Shea will be retiring and therefore will not be standing for re-election at the forthcoming Annual General Meeting (AGM). Mrs Jemima Bird has also decided not to stand for re-election. Consequently, the Board has commenced a search for a new independent Non-Executive Director
For enquiries, please contact:
Potter & Moore PLC info@potterandmooreplc.com +44 1733 281058
Paul Forster, Chairman
Philippa Clark, CEO
Zeus (Nominated Adviser and Broker) +44 203 829 5000
David Foreman / Ed Beddows (Investment Banking)
Nick Searle (Equity Capital Markets)
Chairman's statement
Results and performance
The Group has delivered commendable results considering the wider economic environment and made good progress towards building the resources and personnel to deliver long term revenue growth. The Group has had to deal with significant headwinds in the period both known, such as increases in the National Living Wage and Employer's National Insurance, and unforeseen challenges outside of the Group's control, such as the negative impact on revenue from certain customers who suffered internal logistics and system issues. Despite the headwinds revenue stabilised at £53.8m (FY2025: £54.1m) and gross profit margins improved demonstrating the Groups ability and manage gross margins.
Total overhead costs increased by £0.9m, primarily driven by increased National Living Wage and Employer's National Insurance costs impacting payroll costs, resulting in profit after tax of £2.1m (FY2025: £2.5m).
The Group has continued to generate significant cash from operations, which allowed the Group to reduce structured finance (lease liabilities) by £0.5m and fund a £0.3m dividend payment.
The Board decided to change Creightons PLC's name to Potter & Moore PLC during the year. Potter & Moore better reflects the identity by which many of the Group's customers, all its retail partners, suppliers and employees already recognise the business. The Board believes that aligning the corporate name with its trading identity will enhance brand clarity, strengthen recognition and support more effective engagement with existing and prospective stakeholders.
Strategic development
The Board undertook a comprehensive review of the Group's strategy over the past year with the development of a strategic plan covering the next five years. The aim of the strategic review was to accelerate the growth in revenue and profit before tax by building upon the strengths of the Group. The goal is to deliver significant above trend improvements in shareholder return whilst protecting the interests of all stakeholders.
The strategic review has clarified the Group's growth priorities: strengthening Private Label leadership, building a more focused brand portfolio, accelerating fast-follow opportunities, expanding and leveraging R&D-led product capability, and investing in people, systems and operations to support scalable growth - including the opportunities from automation and AI applications. The key drivers to deliver the revenue and profit growth are detailed in the CEO's report.
As part of the strategy the Executive Leadership Team (ELT) is undertaking a preliminary review into the wellness sector to assess the approach the Group should adopt in penetrating it. Fundamentally, the Group aims to build on its existing expertise in new product development and its extensive customer relationships. The approach adopted may encompass generating sales organically, by sourcing finished products or investing manufacturing in house, or by acquiring an established business.
Finally, the ELT is investigating how to maximise the utilisation of our sites to ensure we can maximise our return on these significant assets.
The Board will continue to actively review and evolve the strategy to ensure it maintains pace and evolves to meet the evolving macro-economic and market environment.
Employees
I would like to thank all our hard working and committed employees who have contributed to the continued success of the Group. The Group attracts talent at all levels within the business and continues to invest in training from apprentice to graduate. The Group has introduced a coaching and mentoring programme for the ELT to develop emerging talent into future leaders.
Investments
The Group has increased its expenditure in investment of capital equipment over the year both in plant and machinery to support improvements in output and productivity and, Information Technology, particularly the new Warehouse Management System and Shop Floor data capture and analysis. Both investments have started to deliver improved productivity with a full year benefit expected in FY2027.
A core ERP system replacement is planned over the next 18 months with the provider's AI capabilities a key selection factor. Adoption will include a broader overhaul of processes and roles to ensure we maximise returns and minimise risk associated with project.
Dividend
The Board remains committed to delivering sustainable and growing returns to shareholders over the long term. Reflecting the Group's strong financial position, cash generation and confidence in the prospects of the business, the Directors are recommending a final dividend of 0.55 pence per ordinary share an increase of 10% on the prior year. This recommendation is consistent with our progressive dividend policy, under which we aim to grow the dividend sustainably over time whilst maintaining appropriate levels of investment in the business and preserving balance sheet strength. The Board will continue to balance shareholder returns with the capital requirements necessary to support the Group's strategic objectives and long-term growth ambitions.
Board of Directors and Corporate Governance
This is the first Annual Report and Accounts the Group prepared in accordance with the 2023 Quoted Companies Alliance Corporate Governance Code (QCA Code) which was adopted on 1 April 2025, following the transition of the Group's listing to AIM.
Pursuant to that process, the Board announced an intention to evolve and reduce its current membership to one more appropriate for a business of its size and complexity. Accordingly, Mr Nick O'Shea (Non-Executive Director) has advised he will be retiring and not putting himself up for re-election at the Company's forthcoming AGM. Nick is our longest serving director. I would like to thank him for his contribution to the development of the Group over many years and wish him all the best in his retirement.
Mrs Jemima Bird has also decided not to stand for re-election. Whilst Jemima will only have served on the Board for 17 months, she made significant contributions at Board Meetings and as Chair of the Remuneration Committee using her extensive experience to evolve and formalise our executive remuneration structure. I wish her all the best with her future endeavours.
Consequently, the Board has commenced a search for a new independent Non-Executive Director. Furthermore, as a non-independent Non-Executive Chairman, I have informed the Board of my intention to retire by the time of the 2027 AGM, affording the Board as much time as possible to appoint my successor. With the improving governance of the Group, as well as the increasing experience and expertise of the executive directors, the coming year feels like the appropriate time to pass on the reins. Also, Mr Bill Glencross, non-independent Non-Executive Director has indicated he will not seek re-election at the 2027 AGM.
Summary and Outlook
I consider the results to be a creditable performance given the external factors which have adversely impacted on performance. The investment in resources to deliver increased revenue started to produce results in FY2026 which is expected to accelerate into FY2027. The Group remains in a strong financial position to take advantage of any opportunities that may arise.
The Group will continue to face challenges during FY2027, again largely due to factors outside the Group's control with rising costs from petro-chemical-linked materials, energy-exposed suppliers, and the increased National Living Wage will continue to pressure margins. Management has stepped up inflationary monitoring to identify mitigation actions and support customer price negotiations, an ongoing focus for the year ahead. Middle East trade carries regional conflict risk, though Saudi Arabia, the source of most Group revenue there, remains unaffected to date, growth elsewhere in the region may be slower to emerge. Customer credit risk remains elevated as economic pressures strain retail customers. AI and broader technological change pose a competitive risk if not capitalised on early. The Group is developing policies to harness AI benefits while protecting data confidentiality.
The Group is in an excellent position to take advantages of any opportunities, whilst managing downside risks. The investment in sales, marketing, product sourcing and development has started to pay dividends and will ensure the Group can take advantage of more opportunities over the coming year. The lead times involved in delivering revenue from new ranges and listing from new customers means we expect to see significant benefits until in the second half of FY2027.
The Board will continue to work closely with the Executive Team to deliver and revise the strategy to grow revenue and profits.
Chief Executive's Statement
Potter & Moore PLC delivered a resilient performance in FY2026, protecting gross margin and maintaining profitability while continuing to execute against its strategic priorities. This performance demonstrates the strength of the Group's operating model, commercial discipline and ability to manage external cost pressures, including the impact of government legislation, while positioning the business for sustainable, profitable growth.
Group revenue of £53.8m (2025: £54.1m) was achieved alongside a gross margin of 44.9% (2025: 44.7%), resulting in a profit before tax of £2.8m (2025: £3.5m). These results reflect the quality of our business model in a year when headwinds were considerable. Operational efficiency, commercial agility and disciplined management of working capital enabled us to protect margins and sustain profitability even as increases to Employer National Insurance Contributions and the National Living Wage created an increased labour cost of £0.9m.
The underlying momentum of the business is positive. New business wins totalling £3.5m were secured during the period, driven by two compelling growth engines: Private Label gains across both existing and new product categories, and the continued strategic pivot of our owned brands to include 'fast follow' trend-led trading an approach that is generating tangible commercial traction with both existing and new retail customers. These gains demonstrate the inherent strength of the dual-revenue model and our ability to compete effectively in an increasingly fast-paced and competitive sector.
These positive developments were offset by a reduction in demand within the contract manufacturing business, together with disruption at certain key retail partners arising from factors outside the Group's control. This included the impact of a key customer's consolidation of its warehousing, distribution, fulfilment and logistics operations, which led to a period of destocking, as well as IT-related disruption experienced by another customer. While these factors constrained overall revenue performance, they do not alter our confidence in the strategic direction of the business or the structural opportunities that lie ahead.
Strategically, the Group made meaningful progress. Our diversified yet complementary revenue streams continue to provide both stability and optionality, and this year we took deliberate steps to embed ways of working that better commercialise our research and development capabilities across both Private Label and branded activities. Improving speed to market and maximising the value of our innovation pipeline are central to our competitive advantage, and the progress made in this area positions us well for the year ahead. The capacity to flex and adapt quickly to respond to shifting market dynamics without compromising on quality or execution remains a defining characteristic of this business, and one we continue to invest in.
The Board remains confident in the Group's direction. With a clear strategy, a strengthened commercial platform and a team that has demonstrated its ability to deliver in difficult conditions, Potter & Moore is well placed to convert its pipeline of opportunities into sustainable, profitable growth and to create long-term value for shareholders.
|
H1 (Unaudited) |
H2 (Unaudited) |
Year ended 31 March 2026 |
|
|
|
£000 |
£000 |
£000 |
|
Revenue |
27,221 |
26,628 |
53,849 |
|
Gross profit |
12,168 |
12,014 |
24,182 |
|
Gross profit % |
44.7% |
45.1% |
44.9% |
|
Operating profit |
1,454 |
1,238 |
2,692 |
|
Operating profit % |
5.3% |
4.6% |
5.0% |
|
Profit before tax |
1,494 |
1,328 |
2,822 |
|
Profit after tax |
1,084 |
1,008 |
2,092 |
Revenue stream performance
Private Label
Private Label sales delivered the strongest revenue growth across the Group, increasing by 9.0% to £31.8m (2025: £29.2m). This was achieved despite significant customer disruption impacting H2 which in its absence would have delivered 13% revenue growth for the channel in the period. This builds on strong growth of 23% in the prior year and 8% in FY24, demonstrating the sustained momentum and long-term potential of this business stream.
Three key drivers are fuelling this continued growth.
· Private label excellence - a full year's trade and continued growth with the two additional strategic retailers secured during the previous trading year.
· Category maximisation - teams working to win additional share of the product offer in the existing categories in which we operate.
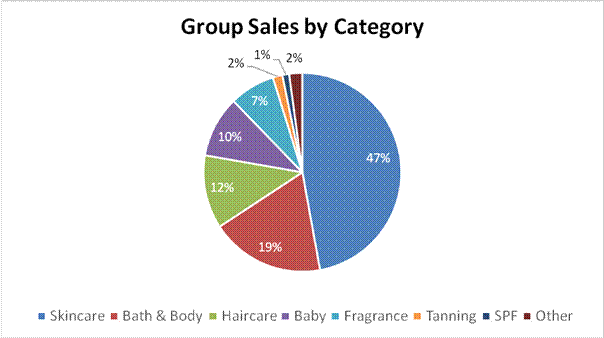
· Category diversification into Sun Protection Factor (SPF) and fragrance categories - the latter being the strongest to deliver in this trading period where we are now supplying three UK retailers with product in the fragrance category.
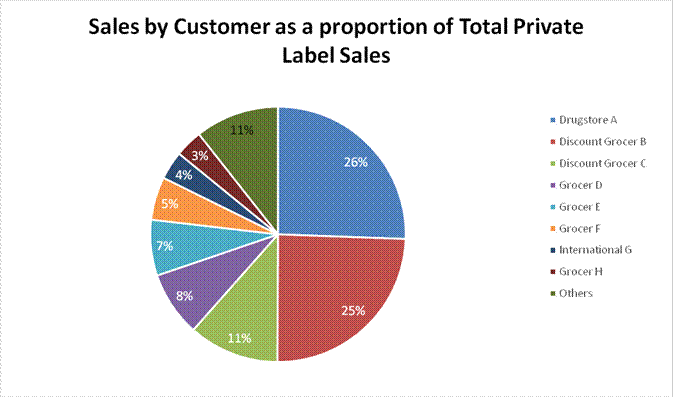
A consistent and continued focus on added value products and categories means that margin performance in Private Label remains positive. This is driven by deep product and category knowledge and underpinned by market leading product development alongside continual improvements in sourcing, procurement, and manufacturing efficiencies.
Investment in team, customer partnerships, speed to market and R&D of market-ready product are central to the Group's proposition. As added value within the Private Label portfolio continues to drive loyalty, quality recognition, and competitive differentiation for retailers, we are well placed to apply our proven expertise to new categories and product opportunities, supporting long term growth.
As a result, Potter & Moore remains a leading Private Label supplier in the UK understanding and delivering strong performance in stock management, forecasting, service levels, cost control, product quality, and technical compliance.
Private Label product categories continue to be both margin-enhancing and brand-strengthening for retailers, while offering consumers a compelling value proposition. It remains a strategic priority for major UK retailers, particularly in the current economic climate where value, quality, and differentiation are paramount and in turn continues to present notable opportunities for growth.
Brands
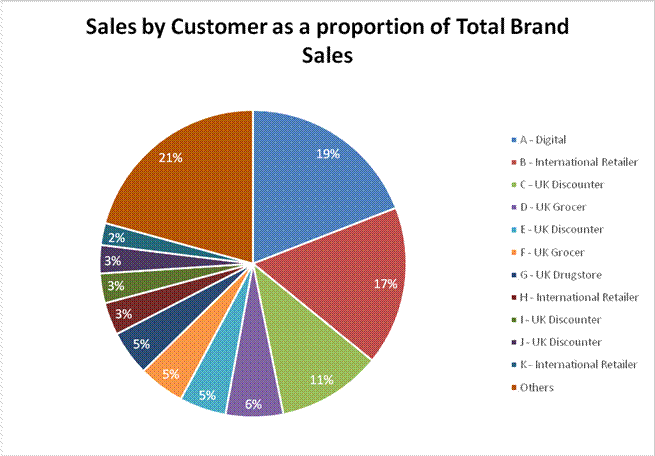
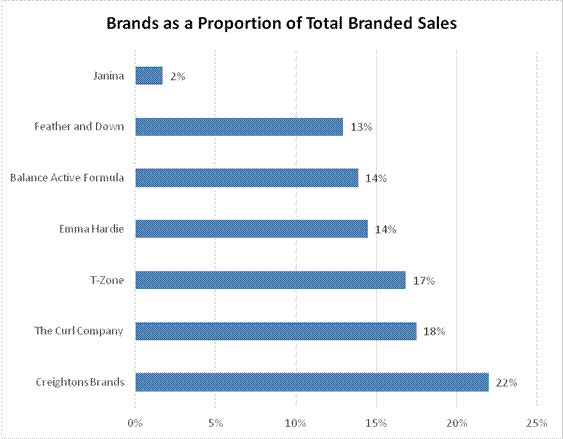
Overall Brands contribute 34% revenue to the Group with a marginal increase to £18.3m (2025: £18.2m), representing a stabilisation following the more significant decline experienced in the prior year, an improvement of the interim results performance.
Core Brand Challenges
Unlike Private Label, the UK market is continuing to be challenging for our core 'must-win' brands with the exception of Amazon. The online marketplace has delivered 15% growth during FY 2026. Positive gains have also been experienced with some key strategic international retail customers in both Europe and the Middle East, specifically for The Curl Company and Tzone brands exhibiting growth of 49% and 345% respectively.
'Fast Follow' Strategy
Recognising the challenges of core retail brands in recent times, the pivot of resources and effort to a 'fast follow' approach has proven positive and driven £1.1m in revenue from a standing start at the beginning of the trading period. This approach has also opened up trade in the USA market with a key off-price retailer which has contributed notably to the momentum. The strategy has also rejuvenated opportunities in UK discount where speed, on-trend and value products are winning with a fast moving, cost conscious consumer.
International Reach
Additionally, a comprehensive review of trading partners across international markets has been undertaken. Moving towards strategic direct to retail opportunities continues to be a central development goal for both Core and Fast Follow brands and products. Additional team resource has been introduced to enable more focus on sales and development opportunities with targeted strategic retailers predominantly in Europe, Middle East and the off-price sector in North America.
Emma Hardie Performance
The strategic refocus of the Emma Hardie brand over the past year has led to an improvement in revenue of £0.4m totalling £3.1m for the period (2025: £2.7m). The brand continued to achieve a positive and profitable contribution to the Group. This was achieved despite taking a considered year long investment into the Chinese market which despite achieving positive trade, did not deliver the momentum targets set. Therefore, we made the decision to exit at the end of Q4. Increased investment in digital sales during the period has begun to yield growth in this channel. Discussions with travel providers in the cruise space continue, and the coming year will determine if this is a positive growth route for the brand.
Digital
Amazon in the UK continues to perform well now representing 16% of total brand sales, an increase of 2% from FY 2025. This continues to be led by ongoing success with Feather and Down due to the price point and wellness trend resonating well with consumers in the online space. Investment in the Amazon team during H2 is focused on building growth in other core brands on the platform with Tzone, The Curl Company and our haircare offer being priorities. Our ambitions in the Amazon marketplace continue to be positive and there is considerable scope for additional growth with our brand portfolio and in our ongoing investment in gradually building the Amazon Germany platform. It is still embryonic but showing positive signs of growth potential in which we will invest more during the 2026/27 fiscal year.
EmmaHardie.com continues to be a strategic priority and delivered 28% growth during the period. Whilst the majority of online beauty purchases increasingly occur through major marketplaces and specialist beauty retailers-where the brand has strong representation-the direct-to-consumer website remains an important part of our channel mix.
Beyond generating higher-margin sales, EmmaHardie.com allows us to control the customer experience, showcase the brand in its entirety, and build direct relationships with consumers. Together with our expanding social media activity, it plays a vital role in strengthening brand awareness, consumer confidence, and loyalty in an intensely competitive space, supporting the overall long-term growth of the business.
Contract Manufacturing
As outlined previously, the Group has de-prioritised this revenue stream over the past 18 months due to both the transactional trade model and relying on the performance of customers' brands for success. Resources over the past 18 months have been reallocated to the Private Label efforts, which has contributed to the growth in this area, and we have now moved all existing customer management into one team. We continue to service a number of long term customer relationships and will continue to do so where the business contributes positively to the Group's overall margin and profitability.
Research and Development (R&D)
At the core of Potter & Moore's strategy is the unwavering commitment to R&D, which remains a fundamental driver of growth, differentiation, and long-term relevance within the beauty industry. The ability to translate consumer needs into effective and innovative solutions is central to our value proposition and continues to earn recognition from both our retail partners and end consumers.
The key focus during the year has been commercialising all R&D efforts across the wider business for maximum benefit and asset realisation. Ways of working have been challenged and amended to incorporate improved assessment of available formulations and technologies as new briefs and opportunities are reviewed. Bringing R&D to the forefront of sales efforts is also aiding improved speed to market, opening up more 'quick win' opportunities, and underpinning the 'fast follow' initiatives within owned brands.
Our R&D and product teams have been instrumental in securing many of the business wins achieved this year with existing and new Private Label retail customers. This includes diversifying into the fragrance category, ongoing skincare expertise with new textures and incorporation of trending performance ingredients and continually refining our SPF formulation capabilities.
The SPF development programme continues to make timely progress, although commercialisation has taken longer than originally anticipated. This reflects the rapid evolution of the category, with changing ingredient requirements, advancing technologies and increasing scrutiny of efficacy validation and testing standards. In response, we have committed additional resources to ensure our innovations are both future-proofed and aligned with evolving market expectations, thereby enhancing the long-term value of the opportunity. Importantly, this period has also enabled us to deepen engagement with leading retail stakeholders, raising our profile within the category and showcasing our technical expertise and innovation capabilities. As a result, we have strengthened our market positioning and continue to build a robust platform for future commercial growth.
Additionally, as part of our strategy to diversify product types and categories, sourcing and technical efforts have been during the period on identifying and verifying external third party sources of product to enhance both our Private Label and branded offer. Positive progress has been made resulting in products launching with key customers from Q1 of 2026/27 onwards, supporting strategic retail partnerships and contributing to revenue growth.
Operationally, the R&D team continues to work in conjunction with procurement on addressing the challenges posed by rising raw material costs while maintaining product efficacy, a crucial factor in meeting the expectations of mass-market retail and consumer demands.
Looking forward, product development remains at the core of the business and its market proposition, leveraging insights, trends, and ideas to develop trusted, on trend, consumer focused products.
Manufacturing and Operations
Manufacturing and operations functions remain fundamental pillars in delivering Potter & Moore's core values of Quality, Innovation and Service to our customers and stakeholders. In a highly competitive and rapidly evolving beauty industry, agility and reliability in manufacturing are critical to our continued success.
During this trading period, several key initiatives have driven progress:
· Implementing a comprehensive digital transformation program to leverage technology and enhance daily operational efficiency - including automated document management, executing a paperless management system on the production floor, and launching a new formulation management system.
· Successfully completed the implementation of the Warehouse Management System (WMS), a strategic investment that has enhanced supply chain efficiency. The system has played a key role in controlling overhead costs, improving operational speed and accuracy, optimising warehouse capacity, and providing a scalable platform to support future growth.
· Ongoing targeted investments in manufacturing plant and machinery to expand both our capabilities, efficiency, and production capacity to support future growth.
· Focusing on workforce skill development through enhanced training programs and progression incentives to build a motivated team for the future.
The relentless focus of our teams on improving manufacturing efficiencies has enabled us to continue to maintain and improve production targets with a single shift. With increasing labour costs keeping a flexible approach to scaling labour as needed via agency management continues to serve the business well. This approach also underpins keeping the labour cost base agile as we move forward with additional system automations, including a new ERP engine and AI solutions to processes.
Procurement savings continue to be a priority, with smart buying aligned to stock holding objectives and a persistent focus on sourcing cost-effective raw materials and packaging. These ongoing efforts are vital given the fast-paced nature of the beauty sector and increasing inflation on input materials and labour as we move through 2026.
Continuous improvement in manufacturing and broader operations is embedded in our business culture to ensure we remain competitive and relevant in an ever-changing market.
The Future and Our Strategy
The Board remains mindful that the near-term outlook continues to be shaped by broader macroeconomic and geopolitical uncertainty. Ongoing conflict in the Middle East, alongside wider geopolitical tensions, has contributed to volatility in global energy, freight and commodity markets, increasing supply chain complexity and placing upward pressure on certain raw material, packaging, and component costs. While the timing and extent of these impacts remain uncertain, these pressures are expected to persist through 2026 and potentially into 2027. More broadly, continued pressure on household budgets and cautious retailer inventory management may result in periods of demand volatility across our end markets. In response to the inflationary pressures cost price increases have been notified to the market during April and May 2026, and meaningful conversations are underway with key retail customers.
Against this backdrop, the Group's business model provides a degree of resilience. Our diversified sourcing network, long-standing supplier relationships and operational flexibility enable us to respond effectively to changing market conditions, while our UK-based manufacturing capabilities support supply chain reliability and speed to market. In addition, periods of economic uncertainty often reinforce retailer focus on value, own-label innovation and trusted supply partners, areas in which Potter & Moore has established strong competitive positioning and a proven track record.
Looking ahead, our strategic priorities are centred on continued Private Label category diversification, leveraging our R&D capabilities, and developing 'fast-follow' brand opportunities. We are also expanding our product offering through third-party sourcing and progressing targeted international market expansion, which together underpin our medium-term growth ambitions.
We further believe that the increasing emphasis on supply chain resilience, product quality and regulatory compliance will continue to favour well-invested, established operators. Our sustained focus on innovation, service excellence, regulatory standards, and disciplined capital allocation positions the Group to strengthen existing customer relationships and secure new opportunities with both domestic and international retail partners.
More broadly, the Group remains well positioned to benefit from the structural growth drivers underpinning the beauty and wellness sectors. By leveraging our market-leading Private Label capability and deep category expertise, alongside targeted branded and wellness-led opportunities, we are able to serve demand across value, mass, and masstige segments. This diversified approach creates multiple avenues for growth while reducing reliance on any single channel, customer, or category.
Over and above the core strategic pillars there is a continued commitment to meet environmental and sustainability targets
· Presently our reduction targets are aligned with the SBTi model. The board will review using SBTi validated reduction targets in the current financial year. Please see further detail outlined in the CFD report of the full accounts.
· Scope 1 and 2 emissions will reduce by 42% and Scope 3 emissions by 25% by 2030. For FY25/26 we have seen a decrease in scope 1 and 2 emissions of 26.9% year on year and 52% from our base year.
· We have just completed the 12th year of holding the RSPO supply chain accreditation.
· Now sourcing 99.9% of our palm derivatives from RSPO sustainable sources.
· For FY25/26 the amount of recycled plastic in our packaging has increased to 276.1 tonnes, 27.3% of to the total amount of plastic bought, an increase of 4.1%.
· We completed the climate change forests modules for the Carbon Disclosure Project (CDP) in the 2025 disclosure cycle, maintaining a B in climate change and scoring a C in forests. Please see further detail outlined in the CFD report of the full accounts.
Summary
Overall, the Group remains profitable, cash-generative and well capitalised, with a resilient operating platform and clear strategic momentum. Despite continued market headwinds, Potter & Moore delivered meaningful progress against its priorities, underpinned by margin discipline, operational agility and a diversified revenue model that supports both stability and future growth.
Looking ahead, manufacturing agility, sourcing capability and innovation will remain critical to meeting consumer demand for newness, performance and value. The Group's multi-channel approach, combined with continued expansion of its multi-category offer, provides flexibility across economic conditions and creates a stronger platform for sustainable revenue growth, margin resilience and improved returns over time.
The Board remains confident in the Group's direction. With a clear strategy, a strengthened growth platform and a team that has demonstrated its ability to deliver in challenging conditions, Potter & Moore is well placed to convert its pipeline of opportunities into sustainable, profitable growth and long-term shareholder value.
Our strategic priorities and future ambitions are subject to ongoing review to ensure they remain relevant, achievable, and aligned to evolving market conditions. This disciplined approach, supported by regular engagement with the Board and senior leadership team, ensures consistency of execution and focus on long-term value creation.
I would like to thank all colleagues across the Group for their hard work, commitment, and professionalism throughout the year. Operating conditions have remained challenging, and our performance reflects their resilience, expertise and focus on delivering for our customers.
I would also like to thank the Board for its continued guidance and support, and our customers, suppliers, shareholders and wider stakeholders for their continued confidence in Potter & Moore. These relationships remain central to our success, strengthening the platform from which we can continue to execute our strategy, pursue disciplined growth and build long-term value.
Chief Financial Officer's review
Overview of Financial performance
Despite a challenging economic backdrop, with continued uncertainty in the UK macroeconomic environment dampening consumer confidence, revenue remained under pressure. Trading during the year was also impacted by disruption at a small number of key customers, as they addressed internal operational issues and market-specific challenges.
Against this backdrop, the Group continued to make good strategic progress, securing a number of important new business wins within both Private Label and Brand. The Private Label part of the business continues to go from strength to strength, supported by the Group's product capabilities, service levels and long-standing customer relationships. These new wins helped to offset the impact of the disruption noted above and provide a strong platform for continued growth in the year ahead.
The results demonstrate the Group's continued commitment to building sustainable organic revenue growth. This includes investment in additional front-end resource to strengthen the Group's commercial capabilities, support organic sales growth and ensure the organisation remains responsive in a fast-moving market. Total spend was approximately £0.4m, with indirect labour headcount increasing by 10 as part of this investment. Although these actions will take time to translate fully into financial performance, encouraging signs are emerging, with branded revenue showing improved momentum through the Fast Follow initiatives and a modest improvement during this trading period compared with the sharper decline experienced in the prior period.
The Group continued to execute its strategy to improve operational gearing and mitigate the impact of increased employment-related costs, including higher taxation, National Insurance Contributions and National Living Wage rates arising from recent government policy changes. These changes also had a knock-on effect on pay differentials across the workforce, the annualised impact of which was approximately £0.9m across both direct and indirect labour. To help offset these pressures, the Group delivered targeted cost-saving initiatives which reduced costs by approximately £0.4m to combat the annual increase in labour costs. In addition, capital investment in automation, together with the implementation of live production data systems, generated manufacturing efficiencies and enabled a reduction of 10 direct labour roles. This resulted in direct labour cost savings of approximately £0.3m and contributed to an improvement in gross profit margins.
Creightons, as it was then known prior to its change of name to PAM PLC in April 2026, transitioned from the Main Market to AIM on 31 March 2025. The Directors considered AIM to be a more appropriate market for the Company's size and structure, providing a regulatory framework better aligned with the Group's current stage of development. The move is expected to deliver ongoing efficiencies, including reduced compliance costs, as well as potential tax benefits for some investors. In the previous year, the transition generated savings of approximately £0.1m through lower recurring compliance costs; however, these were partially offset by one-off costs incurred as part of the move to AIM, which are not expected to recur in future periods. In the current year, the Group is expected to benefit from a further £0.1m of savings arising from the change of auditors.
The Group has maintained its disciplined approach to cost management, ensuring that the operating cost base remains aligned with levels of activity across the business. This continued focus has supported further efficiencies across direct and indirect labour, administrative functions, and warehousing and distribution, helping to protect margins while preserving the flexibility required to support future growth.
Revenue
Overall Group sales were £53.8m for the year ended March 2026 (2025: £54.1m) representing a decrease of £0.3m. Further detail on revenue performance, including movements across the Group's key revenue streams, is set out in the Chief Executive's Statement.
The sales generated by each revenue stream are;
|
2026 |
2025 |
Movement |
|
|
£000's |
£000's |
||
|
Branded products (Own Brands) |
18,306 |
18,176 |
Increase of 0.7% |
|
Private label |
31,766 |
29,154 |
Increase of 9.0% |
|
Contract manufacturing |
3,769 |
6,720 |
Decrease of 43.9% |
|
Other |
8 |
16 |
Decrease of 50.0% |
|
Total |
53,849 |
54,066 |
Decrease of 0.4% |
Going forward, the Group will report and manage its activities across two core revenue streams: Private Label and Own Brand. The previous Contract revenue stream will be incorporated within Private Label, reflecting the fact that this type of business is no longer considered a strategic priority for the business. While the Group will continue to consider profitable contract opportunities where they align with existing capabilities and capacity, it does not intend to actively pursue this area as a separate growth strategy. This simplified structure provides a clearer and more streamlined operating model, allowing the Group to focus resources, commercial activity and management attention on the areas with the greatest strategic relevance and long-term growth potential: Private Label and Own Brand sales.
Gross profit margin
Over recent years, the industry has continued to operate against a backdrop of sustained inflationary pressure across raw materials, packaging, energy, freight and labour. These pressures have been further compounded by recent government policy changes, including increases to the National Living Wage and employer National Insurance Contributions, which have placed additional pressure on direct labour costs in FY2026.
In response, the Group has continued to strengthen its systems and processes for monitoring cost price inflation across all categories of supply. This disciplined approach has enabled the business to take targeted and timely action to protect margins, including product re-engineering, reformulation, selective pricing adjustments and SKU rationalisation. These measures have helped to streamline the product portfolio, improve operational efficiency and focus resources on higher-margin opportunities, while maintaining the Group's commitment to quality, service, innovation and customer relationships.
The Group has maintained its commitment to improving manufacturing efficiencies, supporting the effective management of cost of sales. Key initiatives included the digital production upgrade, which provides real-time performance monitoring to enhance shopfloor productivity, targeted capital investment to improve manufacturing processes, and the initial implementation of a paperless production system. Together, these initiatives delivered operational efficiencies which enabled a reduction of 10 direct labour roles, resulting in direct labour cost savings of approximately £0.3m. These ongoing initiatives are helping to enhance productivity, strengthen operational resilience and ensure the business remains scalable.
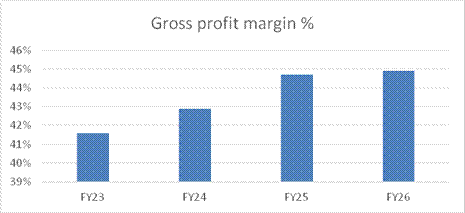
Gross profit margin increased by 20 bps to 44.9% from 44.7% in FY2025. The increase in gross margin in FY2026 to 44.9%, compared with 42.9% in FY2024, represents a further step forward and highlights the effectiveness of the Group's cost focused and operational improvement initiatives. This trend provides a strong platform for future performance as the Group continues to focus on scalable growth, efficiency and sustainable margin improvement.
Overhead costs
The continued focus on disciplined cost management has supported further efficiencies across administrative functions and warehousing and distribution, helping to protect operating margins while preserving the flexibility required to support the business and future growth.
Distribution costs have increased marginally by £0.1m to £2.9m (2025: £2.8m) reflecting the net impact of inflationary pressures across the cost base and the benefit of the operational savings delivered through the Group's ongoing efficiency initiatives. The increase largely reflected inflationary pressure on indirect labour and higher outbound freight costs. This was consistent with wider market conditions, with the logistics sector continuing to experience elevated costs across labour, fuel and carrier networks.
The impact of inflation has, however, been partially mitigated by the implementation of the Group's Warehouse Management System (WMS) in June 2025. This key system and process led investment has begun to drive efficiencies, including improved pick efficiency, enhanced pick accuracy, more transparent space management and better inventory control. Following implementation, the associated labour efficiencies were phased in during the remainder of the year and resulted in a reduction of 2 warehouse roles by the year end. As this reduction was delivered progressively after the WMS went live, the benefit is not fully reflected in the statutory average employee numbers for the year. The full-year benefit of these savings is expected to be realised in the next financial year. The Group will continue to focus on improving warehouse productivity, optimising freight and carrier arrangements, and maintaining strong cost discipline, while ensuring that service levels to customers remain robust.
Administrative expenses rose by £0.7m to £18.6m (2025: £17.9m), primarily reflecting inflationary pressure across the Group's indirect labour base, together with the impact of higher Employer National Insurance Contributions arising from recent government policy changes. The combined impact of these labour-related increases amounted to approximately £0.6m. The increase in admin costs also reflects targeted investment in people to support the Group's organic growth strategy. This investment has been focused on strengthening the front end of the business, including commercial, customer-facing and R&D functions, in addition to sales and key account management resource. These roles are intended to enhance the Group's ability to develop customer relationships, support growth, identify new opportunities and ensure the business remains agile in a fast-moving market. The total investment in additional capability amounted to approximately £0.4m during the year. To help offset these cost pressures, the Group deployed a range of cost-saving initiatives across the overhead base. These initiatives to date have delivered approximately £0.3m of indirect cost benefit during the year. Additionally, the change of auditors has resulted in further savings of £0.1m.
Operating profit and EBITDA
Operating profit decreased by £0.8m to £2.7m (2025: £3.5m), principally reflecting the increase in administrative costs outlined above.
Despite the cost pressures, the Group remained profitable and cash generative. EBITDA for the year was £4.2m (2025: £5.1m), lower than the prior year, but continued to demonstrate the resilience of the business model and the Group's ability to generate operating cash flow while investing in the capabilities required to support future growth. Please see page 20 for how EBITDA is calculated. The resulting impact led to a decrease in profit before tax of 19.3% to £2.8m (2025: £3.5m).
Tax
The Group's effective tax rate for the period was 25.9% (2025: 29.9%). The Group continues to benefit from available R&D tax incentives; however, due to recent changes, these no longer reduce the Group's effective tax rate, a trend seen across the industry and among similar businesses.
The Group continues to monitor the effective tax rate and overall tax strategy of the business and is exploring opportunities to improve the tax efficiency of the group's asset base by ensuring tax relief is maximised by the Group in respect of qualifying assets.
Profit after tax
The Group reported a profit after tax of £2.1m for the year ended 31 March 2026 (2025: £2.5m).
Earnings per share
The diluted earnings per share decreased to 3.04p (2025: 3.29p). Share options that were out of the money have been excluded from the diluted earnings per share calculation for the current year as their inclusion would be anti-dilutive in accordance with IAS 33.
Research and development
The Group undertakes significant research and development activities (R&D) to identify and deliver new product formats, improved formulations to existing products and compliance with increasing regulatory demands. The spend in the year on qualifying research and development for corporation tax relief, including amounts that have been capitalised was £0.9m (2025: £0.6m).
The Group's principal focus in R&D is maintenance and development of brands and products in its existing markets and product ranges. As market and consumer demands continue to increase the Group now develops ranges which involve greater innovative development and claims substantiation which has changed the nature of our research and development activities over recent years. One impact of this industry step change is improved claims for research and development tax relief.
Cash on hand and working capital
Net cash on hand (cash and cash equivalents less short-term element of obligations under finance leases and borrowings) is £3.2m (2025: £3.0m). Although the Group remained profitable during the year, year-end cash balances did not increase at the same rate as earnings, primarily due to the timing of working capital movements. In particular, strong sales activity towards the end of the financial year, including a number of large sales in March, resulted in an increase in trade debtors at the balance sheet date. These amounts were not yet due for collection at year end and are expected to convert into cash in the normal course of business after the reporting date.
Inventory
Inventory on hand decreased by £0.1m to £8.8m (2025: £8.9m) during the year to March 2026 reflecting the Group's controlled approach to stock management and focus on aligning inventory with customer demand and production requirements. The Group will continue to monitor inventory levels closely, and improve stock turn, reducing slow-moving lines, managing out redundant lines quickly and ensuring that stockholding remains appropriate for the scale and mix of the business.
Return on Capital Employed (ROCE)
ROCE decreased by 350 bps from 12.9% to 9.4% (see page 19) primarily as a result of the reduction in operating profit. The Group remains committed to improving returns over the medium term through cost control, margin enhancement and more efficient use of capital. Importantly, the investments made during the year are expected to strengthen the Group's commercial capability, support future revenue growth and improve operating leverage as volumes increase.
Net gearing
The Group has continued to reduce its debt exposure with net gearing of negative 4% (2025: negative 1.7%). Net cash on hand has increased by £0.2m to positive £3.2m (2025: £3.0m). Please refer to the section on Key Performance Indicators on page 19 where they are defined.
Dividend
The Directors propose a final dividend for the year ended 31 March 2026 of 0.55 pence per ordinary share (2025: 0.50 pence per ordinary share). The Group has exhibited strong operational performance and generated cash which in turn has improved the Group's liquidity and reduced its gearing. This is consistent with the Board's objective to align future dividend payments to future underlying earnings and cash requirements of the business. The total dividend paid in the year ended 31 March 2026 was £0.3m (2025: £0.3m).
Principal risks and uncertainties
The Board regularly monitors exposure to key risks, such as those related to production efficiencies, cash position and competitive position relating to sales. It has also taken account of the risks facing the business from the challenging economic environment including inflationary pressures, higher interest rates and their impact on consumer demand. Further details of mitigating measures taken by management are set out on page 2.
It also monitors risks not directly or specifically financial, but capable of having a major impact on the business's financial performance if there is any failure. The key risks and the measures taken to manage these risks are noted below.
Capital structure, cash flow and liquidity
The Group has a strong balance sheet. The business is funded using; retained earnings, a long term mortgage and term loan to support investments in fixed assets, invoice financing and overdraft facilities for working capital. Further details are set out in notes 23 and 24 of the full accounts.
At 31 March 2026 the invoicing financing is in a surplus position of £11,000 (2025: £8,000) as the facility is not being utilised. The operations have generated sufficient cash to improve its liquidity. At 31 March 2026 the Group has not utilised its overdraft facility (2025: £Nil). Further details are set out in note 21 of the full accounts in relation to cashflow and liquidity risk.
Competitive environment
The Group operates in a highly competitive environment in which demand for products can vary and customers have the opportunity to transfer business to other suppliers. The Group works to minimise this risk by developing close relationships with customers offering quality, service and innovation throughout the business. This risk is also further reduced through the development of its branded product portfolio and by the diversity of customers and products offered. All customers are credit insured or pay on proforma basis before supply.
Quality and Safety
The Group treats quality as its key requirement for all products and strives to deliver performance products for every price point. Failure to achieve the required quality and safety standards would have severe consequences for the Group, from financial penalties to the damage to customer relationships. The Group has a robust product development process to mitigate risk wherever possible and to ensure all products are safe and fit for purpose. The Group is subject to frequent internal and external safety, environmental, ethical and quality audits covering both accreditations held and a number of specific operating standards our customers require us to comply with.
Global economic environment
The cost-of-living crisis in the U.K. continues to abate consumer demand. The Group strategy of pursuing a multi-channel approach to the market and a broad multi-category product offering continues to serve us well during times when consumer demand is impacted by a cost-of-living crisis.
The BOE base interest rate has decreased by 0.75% to 3.75% (2025:4.5%) in response to inflationary pressures easing slightly. Inflation continued to have a negative impact on consumer demand and the viability of many businesses. The rate of increase in commodities has eased but core domestic inflation and the prospect of prolonged higher interest rates remains a cause for concern. The rate of domestic inflation has reduced as reflected by the reduction in the BOE base rate. Please see note 21 of the full accounts for impact of interest sensitivity on our current level of gearing.
The global supply chain continues to be impacted by the war in Ukraine and the Red Sea issues due to the ongoing conflict in the Middle East. The cost of importation of goods has increased as well as delivery lead times. These continue to be closely managed by working collaboratively with our supply base.
The recent disruption caused by higher U.S. tariffs has had no material impact on our business operations. This is primarily due to our minimal exposure to the U.S. market, with no significant customers or suppliers based in the region. As a result, our supply chains and revenue streams have remained stable, allowing us to continue operations without the challenges faced by businesses more directly connected to the U.S. economy.
The Group monitors C.P.I's across all categories of supply. Mitigation measures included product re-engineering, re-formulating, and increasing customer selling prices where appropriate.
The Directors have taken account of these potential impacts in their going concern assessments and have concluded that the direct impact is not significant to the business, with the indirect impact of price increases being reviewed on a regular basis. In the face of these challenges the focus of the business will be on positive cash generation and restoration of profitability.
Credit risk
Our credit risk is that our customers are unable to pay, and we believe this risk is elevated currently due to the current global economic climate. We proactively manage the risks faced by our customers by working closely with them and by increasing debtor management and expanding our credit insurance. All customers' debtor balances, are within insured credit limits or they pay on a pro-forma basis. Credit control processes are in place to manage credit risk including setting appropriate credit limits and the enforcement of credit terms and ongoing dialogue with all customers. We minimise the risk from concentration of customers through implementation of these credit processes and this risk is mitigated through the diversity of our customer base both by channel and geography. We remain vigilant to the credit risks in light of the challenging economic environment.
Supplier sourcing and costs
Cost increases driven by inflation, along with global material supply pressures, remain our key supplier-related risks. While pressure on global supply chains has eased, uncertainty around future commodity pricing persists.
We continue to work closely with our suppliers and have leveraged improved sourcing capabilities to expand our supply base. This helps us meet demand from both existing and new customers while minimising the impact of cost increases.
We maintain an active dialogue with suppliers to stay informed of commodity price movements and keep open lines of communication with customers to anticipate changes in demand, thereby mitigating potential impacts on the business.
Environmental protection standards and sustainability
The Group's technical department continues to monitor all relevant environmental regulations that the Group must adhere to, to ensure continued compliance. We have successfully operated at both manufacturing sites without a cessation in production due to an environmental incident. The risk of cessation of production from an environmental breach is considered to be low but in such an event we would be able to move production to the other site or to outsource to third party manufacturers in the short term.
The Group's objective is to keep ahead of the move towards more sustainable products and processes. There is a risk that if we do not take action we will be left behind and unable to meet our customers' requirements. However, the Group sees the move towards sustainability as an opportunity for business growth.
Cyber security
Cyber Security remains a significant threat to all businesses. The Group is exposed to the risk of sophisticated cyber-attacks aimed at causing direct financial loss from theft of funds, ransom payments, and costs associated with system recovery and data restoration. Such attacks also lead to business interruption, causing lost productivity and revenue. There is also a heightened risk of theft and encryption of confidential data for financial gain and reputational damage.
The Group has continued to invest in new software and resources to minimise the risk of anyone accessing our systems and information. We have enhanced our ongoing training programme for employees to ensure that they are constantly aware of their role in protecting the business from all cyber security threats. The Group has an insurance policy in place to minimise its exposure to cybercrime.
Consolidated income statement
|
Year ended 31 March 2026 Audited |
Year ended 31 March 2025 Audited |
|
|
£000 |
£000 |
|
|
Revenue |
53,849 |
54,066 |
|
Cost of sales |
(29,667) |
(29,913) |
|
Gross profit |
24,182 |
24,153 |
|
Distribution costs |
(2,870) |
(2,763) |
|
Administrative expenses |
(18,620) |
(17,859) |
|
Operating profit |
2,692 |
3,531 |
|
Other income - Research and Development Expenditure Credit (RDEC) |
215 |
127 |
|
Finance costs |
(117) |
(161) |
|
Finance income |
32 |
- |
|
Profit before tax |
2,822 |
3,497 |
|
Taxation |
(730) |
(1,045) |
|
Profit / (Loss) for the year attributable to the equity shareholders |
2,092 |
2,452 |
Earnings per share
|
Year ended 31 March Audited |
Year ended 31 March Audited |
|
|
2026 |
2025 |
|
|
Basic |
3.05p |
3.58p |
|
Diluted* |
3.04p |
3.29p |
*Share options that were out of the money have been excluded from the diluted weighted average number of shares calculation for the year ended 31 March 2026 as their inclusion would be anti-dilutive in accordance with IAS 33.
Consolidated statement of comprehensive income
|
Year ended 31 March 2026 Audited |
Year ended 31 March 2025 Audited |
|
|
£000 |
£000 |
|
|
Profit / (Loss) for the year |
2,092 |
2,452 |
|
Items that may be subsequently reclassified to profit and loss: |
||
|
Exchange differences on translating foreign operations |
(66) |
7 |
|
Other comprehensive income for the year |
(66) |
7 |
|
Total comprehensive income for the year attributable to the equity shareholders |
2,026 |
2,459 |
Consolidated balance sheet
|
31 March |
31 March |
|
|
2026 |
2025 |
|
|
Audited |
Audited |
|
|
£000 |
£000 |
|
|
Non-current assets |
||
|
Goodwill |
1,575 |
1,575 |
|
Other intangible assets |
6,481 |
6,434 |
|
Property, plant and equipment |
4,488 |
4,658 |
|
Right-of-use assets |
658 |
1,242 |
|
13,202 |
13,909 |
|
|
Current assets |
||
|
Inventories |
8,803 |
8,872 |
|
Trade and other receivables |
13,993 |
11,697 |
|
Corporation tax repayable |
82 |
- |
|
Cash and cash equivalents |
3,630 |
3,659 |
|
26,508 |
24,228 |
|
|
|
|
|
|
Total assets |
39,710 |
38,137 |
|
|
||
|
Current liabilities |
||
|
Trade and other payables |
9,352 |
8,854 |
|
Corporation tax payable |
- |
9 |
|
Lease liabilities |
256 |
447 |
|
Borrowings |
197 |
190 |
|
9,805 |
9,500 |
|
|
|
||
|
Net current assets |
16,703 |
14,728 |
|
|
|
|
|
Non-current liabilities |
|
|
|
Deferred tax liability |
1,847 |
1,799 |
|
Lease liabilities |
419 |
705 |
|
Borrowings |
1,711 |
1,910 |
|
3,977 |
4,414 |
|
|
|
|
|
|
Total liabilities |
13,782 |
13,914 |
|
|
|
|
|
Net assets |
25,928 |
24,223 |
|
|
||
|
Equity |
||
|
Share capital |
701 |
700 |
|
Share premium account |
2,036 |
2,024 |
|
Merger reserve |
2,476 |
2,476 |
|
Treasury shares |
(576) |
(576) |
|
Other reserves |
(211) |
(211) |
|
Translation reserve |
(32) |
34 |
|
Retained earnings |
21,534 |
19,776 |
|
Total equity attributable to the equity shareholders of the parent Company |
25,928 |
24,223 |
Consolidated statement of changes in equity
|
|
Share capital |
Share premium account |
Merger reserve |
Treasury Shares |
Other reserves |
Translation reserve |
Retained earnings |
Total equity |
|
£000 |
£000 |
£000 |
£000 |
£000 |
£000 |
£000 |
£000 |
|
|
At 1 April 2024 |
700 |
2,024 |
2,476 |
(576) |
(211) |
27 |
17,615 |
22,055 |
|
Comprehensive income for the year |
||||||||
|
Profit for the year |
- |
- |
- |
- |
- |
- |
2,452 |
2,452 |
|
Exchange differences on translation of foreign operations |
- |
- |
- |
- |
- |
7 |
- |
7 |
|
Total comprehensive profit for the year |
- |
- |
- |
- |
- |
7 |
2,452 |
2,459 |
|
|
|
|||||||
|
Contributions by and distributions to owners |
||||||||
|
Share-based payment charge |
- |
- |
- |
- |
- |
- |
36 |
36 |
|
Deferred tax through Equity |
- |
- |
- |
- |
- |
- |
(20) |
(20) |
|
Dividends paid |
(307) |
(307) |
||||||
|
Total contributions by and distributions to owners |
- |
- |
- |
- |
- |
- |
(291) |
(291) |
|
|
|
|
|
|
|
|
|
|
|
At 31 March 2025 |
700 |
2,024 |
2,476 |
(576) |
(211) |
34 |
19,776 |
24,223 |
|
Comprehensive income for the year |
||||||||
|
Profit for the year |
- |
- |
- |
- |
- |
- |
2,092 |
2,092 |
|
Exchange differences on translation of foreign operations |
- |
- |
- |
- |
- |
(66) |
- |
(66) |
|
Total comprehensive loss for the year |
- |
- |
- |
- |
- |
(66) |
2,092 |
2,026 |
|
Contributions by and distributions to owners |
||||||||
|
Exercise of options |
1 |
12 |
- |
- |
- |
- |
- |
13 |
|
Share-based payment charge |
- |
- |
- |
- |
- |
- |
7 |
7 |
|
Dividends paid |
- |
- |
- |
- |
- |
- |
(341) |
(341) |
|
Total contributions by and distributions to owners |
1 |
12 |
- |
- |
- |
- |
(334) |
(321) |
|
|
||||||||
|
At 31 March 2026 |
701 |
2,036 |
2,476 |
(576) |
(211) |
(32) |
21,534 |
25,928 |
Consolidated cash flow statement
|
Year ended 31 March |
Year ended 31 March |
|
|
2026 |
2025 |
|
|
Audited |
Audited |
|
|
£000 |
£000 |
|
|
Profit from operations |
2,692 |
3,531 |
|
Adjustments for: |
||
|
Depreciation on property, plant and equipment |
767 |
956 |
|
Depreciation on right of use assets |
436 |
445 |
|
Amortisation of intangible assets |
350 |
183 |
|
(Profit) /Loss on disposal of Right of Use assets |
- |
(12) |
|
Loss on disposal of PPE |
6 |
34 |
|
Share based payment charge |
7 |
36 |
|
|
4,258 |
5,173 |
|
(Increase)/Decrease in inventories |
69 |
(647) |
|
(Increase)/Decrease in trade and other receivables |
(2,296) |
(1,179) |
|
Increase/(Decrease) in trade and other payables |
498 |
589 |
|
Cash generated from operations |
2,529 |
3,936 |
|
Taxation paid |
(559) |
(1,030) |
|
Net cash generated from operating activities |
1,970 |
2,906 |
|
Investing activities |
||
|
Purchase of property, plant and equipment |
(480) |
(429) |
|
Purchase of intangible assets |
(397) |
(243) |
|
Proceeds from sale of assets |
- |
10 |
|
Bank interest received |
15 |
- |
|
Corporation tax interest received |
17 |
- |
|
Net cash used in investing activities |
(845) |
(662) |
|
Financing activities |
||
|
Proceeds on issue of shares |
13 |
- |
|
Principal paid on lease liabilities |
(507) |
(507) |
|
Repayment of amounts borrowed |
- |
(34) |
|
Repayment on term loan |
- |
(611) |
|
Interest paid on term loan |
- |
(18) |
|
Repayment on mortgage loan facility |
(192) |
(187) |
|
Interest paid on mortgage loan facility |
(61) |
(66) |
|
Dividends paid to owners of the parent |
(341) |
(307) |
|
Net cash used in financing activities |
(1,088) |
(1,730) |
|
Net increase in cash and cash equivalents |
37 |
514 |
|
|
||
|
Cash and cash equivalents at start of year |
3,659 |
3,138 |
|
Effect of foreign exchange rate changes |
(66) |
7 |
|
Cash and cash equivalents at end of year |
3,630 |
3,659 |
Notes to financial statements:
1. Significant accounting policies
Basis of accounting
The financial information set out in this announcement does not constitute statutory accounts as defined in Section 434 of the Companies Act 2006. The Company's statutory financial statements for the year ended 31 March 2026, prepared under UK-adopted international accounting standards, will be filed with the Registrar of Companies following the Company's Annual General Meeting. The auditor's report on those financial statements is unqualified, does not include references to any matters to which the auditors drew attention by way of emphasis, without qualifying their report and does not contain statements under Sections 498(2) and 498 (3) of the Companies Act 2006.
The financial information for the year ended 31 March 2025 is derived from the financial statements for that year, which have been delivered to the Registrar of Companies. The auditor's report on the 2025 financial statement was unqualified, did not include references to any matters to which the auditors drew attention by way of emphasis, without qualifying their report and did not contain statements under section 498(2) and (3) of the Companies Act 2006.
This announcement has been prepared in accordance with the Company's accounting policies which are based on International Financial Reporting Standards (IFRS Accounting Standards), though it is noted that this announcement does not contain sufficient information itself to comply with IFRS Accounting Standards.
The accounting policies are the same as those applied in preparation of the financial statements for the year ended 31 March 2026.
2. Financial instruments and treasury risk management
Cash flow and liquidity risk
Liquidity risk arises from the Group's management of working capital. It is the risk that the Group will encounter difficulty in meeting its financial obligations as they fall due.
The following is the maturity analysis of the undiscounted cash flows:
At 31 March 2026
|
Group |
|||||
|
Less than 6 months |
Between 6 months and 1 year |
Between 1 and 5 years |
Over 5 years |
Total |
|
|
£000 |
£000 |
£000 |
£000 |
£'000 |
|
Trade payables |
5,626 |
- |
- |
- |
5,626 |
Accruals |
2,697 |
- |
- |
- |
2,697 |
Lease liabilities |
159 |
124 |
447 |
- |
730 |
Loan |
126 |
126 |
1,010 |
900 |
2,162 |
Total |
8,608 |
250 |
1,457 |
900 |
11,215 |
At 31 March 2025
|
Group |
|||||
|
Less than 6 months |
Between 6 months and 1 year |
Between 1 and 5 years |
Over 5 years |
Total |
|
|
£000 |
£000 |
£000 |
£000 |
£'000 |
|
Trade payables |
5,585 |
- |
- |
- |
5,585 |
Accruals |
2,354 |
- |
- |
- |
2,354 |
Lease liabilities |
252 |
252 |
754 |
11 |
1,269 |
Loan |
126 |
126 |
1,010 |
1,153 |
2,415 |
Total |
8,317 |
378 |
1,764 |
1,164 |
11,623 |
The Group manages its working capital requirements through overdrafts and invoice finance facilities. These facilities were renewed in January 2026 for a further 12 months. The maturity profile of the committed bank facilities is reviewed regularly and such facilities are extended or replaced well in advance of their expiry. The Group has complied with the terms of these facilities.
At 31 March 2026 the Group had available £5,682,000 (2025: £6,193,000) of undrawn committed borrowing facilities in respect of which all conditions precedent had been met.
The Group has a fixed rate mortgage for a 15 year term secured on the property with an interest rate of 3.04% fixed for the next 3.5 years of the loan. As this mortgage is fixed rate, principal and interest obligations are known and predictable, which reduces liquidity risk.
Credit risk
Credit risk is the risk of financial loss to the Group if a customer fails to meet its contractual obligations.
Trading exposures are monitored by the operational Companies against agreed policy levels. Credit insurance with a world leading insurer is employed across the majority of our trade debtors. At 31 March 2026 all trade debtors (2025: all) are covered by credit insurance with a cover of 90% of the debtor balances. Non-trading financial exposures are incurred only with the Group's bankers or other institutions with prior approval of the Board of Directors.
The majority of trade receivables are with retail customers. The maximum exposure to credit risk is represented by the carrying amount of those financial assets in the balance sheet.
Impairment provisions on trade receivables have been disclosed in note 19 of the full accounts.
The credit risk on liquid funds such as cash and cash equivalents is limited because the counterparties are banks
with high credit-ratings assigned by international credit rating agencies.
All trade debtors are credit insured. As a result, the maximum loss on any customer default is limited to the uninsured portion of the receivable, being 10% of the invoiced value (net of VAT). This exposure is reflected in the expected credit loss provision disclosed in note 19 of the full accounts.
Market risk
Market risk is the risk that arises from movements in inventory prices, interest rates, exchange rates, and commodity prices.
Market risk for the 31 March 2026 year end is reflected within the interest rate and foreign currency risk which are discussed further below.
Interest rate risk
The Group's interest rate exposure arises mainly from its interest-bearing borrowings.
The Group finances its operations through a mixture of debt associated with working capital facilities and equity. The Group is exposed to changes in interest rates on its floating rate working capital facilities. The variability and scale of these facilities is such that the Group does not consider it cost effective to hedge against this risk.
The Group also secured a fixed rate mortgage for a 15 year term, 8.5 years remaining, secured on the property with an interest rate of 3.04% fixed for the first 10 years, 3.5 years remaining, of the loan, therefore reducing the interest rate risk. The interest charge on the mortgage for the year ended 31 March 2026 was £61,000 (2025: £66,000). As the mortgage is fixed rate, it is not subject to interest rate sensitivity for the remaining fixed term.
On 3 September 2021, the Group took out a term loan of £3,000,000 to fund part of the purchase of the acquisitions during 2022. The term loan was for a 4 year term secured on the assets of the Group with an interest rate of 2.70% above the Bank of England base rate. The term loan was fully repaid during FY 25. The interest charge on the term loan for the period to 31 March 2025 was £17,000. A 1% increase in the interest rate during the prior year would have resulted in an additional charge of £5,900 on the term loan only. As a result of repaying the loan in full in the prior year, there was no outstanding balance on the loan at the year end. The repayment of the loan reduced the company's exposure to interest rate risk.
Interest rate sensitivity
The interest rate sensitivity is based upon the Group's borrowings over the year assuming a 1% increase or decrease which is used when reporting interest rate risk internally to key management personnel.
A 1% increase in bank base rates would reduce Group pre-tax profits by £8,500 (2025: £12,000). A 1% decrease would have the opposite effect. The Group's sensitivity to interest rates has changed during the current year due to the current economic climate, which has had the impact of decreasing BOE base rates.
Foreign currency risks
The Group operates in a number of markets across the world and is exposed to foreign currency transaction and translation risks arising on the purchase and sales of goods in particular with respect to the US dollar and Euro.
Transaction risk arises on income and expenditure in currencies other than the functional currency of each Group Company. The magnitude of this risk is relatively low as the majority of the Group's income and expenditure are denominated in the functional currency. Approximately 1.2% (2025: 0.3%) of the Group's income is denominated in US dollars and 0% (2025: 1%) in Euros. Approximately 4% (2025: 3%) of the Group's expenditure is denominated in US dollars and 5% (2025: 4%) in Euros.
Foreign currency sensitivity
A 5% strengthening of sterling would result in a £183,000 (2025: £142,000) increase in profits and equity. A 5% weakening in sterling would result in a £202,000 (2025: £157,000) reduction in profits and equity.
When appropriate the Group utilises currency derivatives to hedge against significant future transactions and cash flow. There were no outstanding contracts as at 31 March 2026 or 31 March 2025.
3. Financial assets
Financial assets are recognised in the Statement of financial position within the following headings. These are measured at amortised cost in accordance with IFRS 9 and are detailed below.
|
Group |
Company |
|||
|
2026 |
2025 |
2026 |
2025 |
|
|
£000 |
£000 |
£000 |
£000 |
|
Trade and other receivables |
13,288 |
11,100 |
3,487 |
3,988 |
Cash and cash equivalents |
3,630 |
3,659 |
5 |
42 |
Total |
16,918 |
14,759 |
3,492 |
4,030 |
4. Financial liabilities
Financial liabilities are recognised in the Statement of financial position within the following headings. These are carried at amortised cost using the effective interest rate method in accordance with IFRS 9 and are detailed below.
At 31 March 2026
|
Group |
|||||
|
Less than 6 months |
Between 6 months and 1 year |
Between 1 and 5 years |
Over 5 years |
Total |
|
|
£000 |
£000 |
£000 |
£000 |
£'000 |
|
|
Trade payables |
5,626 |
- |
- |
- |
5,626 |
|
Accruals |
2,697 |
- |
- |
- |
2,697 |
|
Lease liabilities |
144 |
112 |
419 |
- |
675 |
|
Loan |
98 |
99 |
856 |
855 |
1,908 |
|
Total |
8,565 |
211 |
1,275 |
855 |
10,906 |
At 31 March 2025
|
Group |
|||||
|
Less than 6 months |
Between 6 months and 1 year |
Between 1 and 5 years |
Over 5 years |
Total |
|
|
£000 |
£000 |
£000 |
£000 |
£'000 |
|
|
Trade payables |
5,585 |
- |
- |
- |
5,585 |
|
Accruals |
2,354 |
- |
- |
- |
2,354 |
|
Lease liabilities |
220 |
227 |
702 |
3 |
1,152 |
|
Loan |
94 |
96 |
830 |
1,080 |
2,100 |
|
Total |
8,253 |
323 |
1,532 |
1,083 |
11,191 |
5. Earnings per share
The calculation of the basic and diluted earnings per share is based on the following data:
|
|
Year ended 31 March |
Year ended 31 March |
|
|
2026 |
2025 |
|
|
£000 |
£000 |
|
Earnings |
|
|
|
Profit attributable to the equity holders of the parent Company |
2,092 |
2,452 |
|
|
Year ended 31 March |
Year ended 31 March |
|
|
2026 |
2025 |
|
|
Number |
Number |
|
Number of shares |
|
|
|
Weighted average number of ordinary shares for the purposes of basic earnings per share |
68,493,160 |
68,435,383 |
|
|
||
|
Effect of dilutive potential ordinary shares relating to share options * |
330,768 |
6,205,687 |
|
|
||
|
Weighted average number of ordinary shares for the purposes of Adjusted Earnings per share (2024: for the purpose of Diluted Earnings per share) |
68,823,928 |
74,641,070 |
|
Basic earnings per share - including exceptional items |
3.05p |
3.58p |
|
Diluted earnings per share |
3.04p |
3.29p |
*Share options that were out of the money have been excluded from the diluted weighted average number of shares calculation for the year ended 31 March 2026 as their inclusion would be anti-dilutive in accordance with IAS 33.
6. Share capital
|
Ordinary shares of 1p each |
||
|
£000 |
Number |
|
|
At 1 April 2024 |
700 |
70,035,383 |
|
Issued in the year |
- |
- |
|
At 31 March 2025 |
700 |
70,035,383 |
|
Issued in the year |
1 |
91,940 |
|
At 31 March 2026 |
701 |
70,127,323 |
The Company has one class of ordinary shares which carry no right to fixed income. All of the shares are issued and fully paid. The total proceeds from the issue of shares from the exercise of share options in the year was £13,000 (2025: £Nil).
7. Notes to cash flow statement
Analysis of changes in net debt
|
|
Overdraft |
Mortgage |
Loan |
Total |
|
|
£000 |
£000 |
£000 |
£000 |
|
|
|
|
|
|
|
At 1 April 2025 |
- |
2,100 |
- |
2,100 |
|
Cash outflow - principal |
- |
(192) |
- |
(192) |
|
Cash outflow - interest |
- |
(61) |
- |
(61) |
|
Interest accruing |
- |
61 |
- |
61 |
|
|
|
|
|
|
|
At 31 March 2026 |
- |
1,908 |
- |
1,908 |
|
|
Overdraft |
Mortgage |
Loan |
Total |
|
|
£000 |
£000 |
£000 |
£000 |
|
|
|
|
|
|
|
At 1 April 2024 |
37 |
2,287 |
611 |
2,935 |
|
Cash outflow - principal |
(34) |
(187) |
(611) |
(832) |
|
Cash outflow - interest |
- |
(66) |
(18) |
(84) |
|
Interest accruing |
(3) |
66 |
18 |
81 |
|
|
|
|
|
|
|
At 31 March 2025 |
- |
2,100 |
- |
2,100 |
The mortgage balance pertains specifically to the Company.
8. Dividends
|
|
Year ended 31 March |
Year ended |
|
31 March |
||
|
|
2026 |
2025 |
|
£000 |
£000 |
|
|
Final dividend paid - 0.50 pence (2025: 0.45 pence) per ordinary share |
341 |
307 |
|
Total dividend paid in year - 0.50 pence (2025: 0.45 pence) per ordinary share |
341 |
307 |
|
Proposed - 0.55 pence (2025: 0.50 pence) per ordinary share |
376 |
349 |
This information is provided by RNS, the news service of the London Stock Exchange. RNS is approved by the Financial Conduct Authority to act as a Primary Information Provider in the United Kingdom. Terms and conditions relating to the use and distribution of this information may apply. For further information, please contact rns@lseg.com or visit www.rns.com.
RNS may use your IP address to confirm compliance with the terms and conditions, to analyse how you engage with the information contained in this communication, and to share such analysis on an anonymised basis with others as part of our commercial services. For further information about how RNS and the London Stock Exchange use the personal data you provide us, please see our Privacy Policy.
ENDRNS may use your IP address to confirm compliance with the terms and conditions, to analyse how you engage with the information contained in this communication, and to share such analysis on an anonymised basis with others as part of our commercial services. For further information about how RNS and the London Stock Exchange use the personal data you provide us, please see our Privacy Policy.